
The Best Daycare Centers
We graded 80 companies on seven things customers actually report: satisfaction, reliability, workmanship, value, momentum, track record and how owners handle complaints.
From 5,514 Google reviews of 80 top-rated daycare centers nationwide. Updated November 1, 2026.
Find the right company for your job
Pick the job — we re-rank companies by how customers rated that exact job.
Best daycare centers for meal preparation
Clear ✕ Childtime on CrooksHow Job match is calculatedBuilt only from reviews Google tagged “Meal preparation”:Stars on this job 55%5.00★Number of such jobs 25%22Overall Experts Score 20%92Job match= 94Stars are pulled toward the category average (4.80★) when a company has few tagged jobs, so 3 perfect reviews don’t beat 80 great ones. 4.3★ scores 0, 5.0★ scores full. Volume is compared with the busiest company for this job.94
 The Learning Experience - ClarkstonHow Job match is calculatedBuilt only from reviews Google tagged “Meal preparation”:Stars on this job 55%5.00★Number of such jobs 25%5Overall Experts Score 20%90Job match= 78Stars are pulled toward the category average (4.80★) when a company has few tagged jobs, so 3 perfect reviews don’t beat 80 great ones. 4.3★ scores 0, 5.0★ scores full. Volume is compared with the busiest company for this job.78
 The Growing Years Learning Centers (Cary, NC)How Job match is calculatedBuilt only from reviews Google tagged “Meal preparation”:Stars on this job 55%5.00★Number of such jobs 25%7Overall Experts Score 20%65Job match= 76Stars are pulled toward the category average (4.80★) when a company has few tagged jobs, so 3 perfect reviews don’t beat 80 great ones. 4.3★ scores 0, 5.0★ scores full. Volume is compared with the busiest company for this job.76
 Star Mountain Learning Center - WestHow Job match is calculatedBuilt only from reviews Google tagged “Meal preparation”:Stars on this job 55%5.00★Number of such jobs 25%4Overall Experts Score 20%92Job match= 76Stars are pulled toward the category average (4.80★) when a company has few tagged jobs, so 3 perfect reviews don’t beat 80 great ones. 4.3★ scores 0, 5.0★ scores full. Volume is compared with the busiest company for this job.76
 Creative Minds AcademyHow Job match is calculatedBuilt only from reviews Google tagged “Meal preparation”:Stars on this job 55%5.00★Number of such jobs 25%5Overall Experts Score 20%76Job match= 75Stars are pulled toward the category average (4.80★) when a company has few tagged jobs, so 3 perfect reviews don’t beat 80 great ones. 4.3★ scores 0, 5.0★ scores full. Volume is compared with the busiest company for this job.75
 El Bambino Pre-school & DaycareHow Job match is calculatedBuilt only from reviews Google tagged “Meal preparation”:Stars on this job 55%5.00★Number of such jobs 25%5Overall Experts Score 20%79Job match= 75Stars are pulled toward the category average (4.80★) when a company has few tagged jobs, so 3 perfect reviews don’t beat 80 great ones. 4.3★ scores 0, 5.0★ scores full. Volume is compared with the busiest company for this job.75
 The Goddard School of KirklandHow Job match is calculatedBuilt only from reviews Google tagged “Meal preparation”:Stars on this job 55%5.00★Number of such jobs 25%3Overall Experts Score 20%96Job match= 74Stars are pulled toward the category average (4.80★) when a company has few tagged jobs, so 3 perfect reviews don’t beat 80 great ones. 4.3★ scores 0, 5.0★ scores full. Volume is compared with the busiest company for this job.74
 KidzSpace Family ChildcareHow Job match is calculatedBuilt only from reviews Google tagged “Meal preparation”:Stars on this job 55%5.00★Number of such jobs 25%3Overall Experts Score 20%94Job match= 73Stars are pulled toward the category average (4.80★) when a company has few tagged jobs, so 3 perfect reviews don’t beat 80 great ones. 4.3★ scores 0, 5.0★ scores full. Volume is compared with the busiest company for this job.73
Job match = this company’s ★ on reviews Google tagged “Meal preparation” (shrunk toward the category average when there are few), how many such jobs it has done, and its overall Experts Score.
What customers said about meal preparation
The Learning Experience - Clarkst…We’ve had a great experience with TLE since our son started over the summer! It’s been wonderful to see how much he’s learning, from sign language to becoming more social and interactive. Ms. Solae and Miss Melissa are fantastic, and we really appreciate the updates they share throughout the day. As parents, it means so much knowing he’s well cared for.
Star Mountain Learning Center - W…I’ve taken my preschooler for drop-ins and week-long care as needed, and he’s always had a wonderful time! The director and teachers/staff are so caring, attentive, passionate, and treat my son like their own. They have an enriching curriculum and serve nutritious meals! My son is safe since they have locked…
Creative Minds AcademyAbsolutely love this daycare and my daughter does too. She always tell me how much she love her teacher and the staff. Mrs. Felecia made sure I was comfortable and show me all the things my daughter will be learning while there. They send you updates on your child throughout the day I absolutely love that.
The Growing Years Learning Center…I have never had such a huge group of women that have a loving and supportive relationship with my children! TGY is more than a daycare; they are family!
Childtime on CrooksWe only needed childcare for a short time but had a wonderful experience here. The director Rebecca was easy to work with and accommodating to our circumstances. The teachers really showed care and attentiveness to my toddler. We loved the app with constant livestream of our child’s classroom and pictures/video…
El Bambino Pre-school & DaycareDurante casi 2 años pudimos disfrutar de los servicios de El Bambino con mi hijo de 2 años todos los dias y ocasionalmente con mi hija. La directora y todas las maestras nos ayudaron al crecimiento y enseñanza de nuestros hijos que es lo mas importante para nosotros. Mi hijo siempre llegaba contento a la escuela y…
Overall ratings
Experts Score 0–100Experts Score (0–100)Absolute quality first: recency-weighted star average (≈54%), share of 1–2★ reviews (≈24%), customers’ price verdicts (≈14%), owner replies to critical reviews (≈7%); minus up to 10 points each for complaints flagged in Google review highlights and for a real slide in recent ratings. Hover a company’s score on its page for the full breakdown. and a letter grade per factor (A = top 20% of daycare centers).
| # | Company | ScoreExperts Score (0–100)Absolute quality first: recency-weighted star average (≈54%), share of 1–2★ reviews (≈24%), customers’ price verdicts (≈14%), owner replies to critical reviews (≈7%); minus up to 10 points each for complaints flagged in Google review highlights and for a real slide in recent ratings. Hover a company’s score on its page for the full breakdown. | FactorsFactor grades, in orderSatisfaction (54%): Recency-weighted star average (2-year half-life), shrunk toward the category mean by review volume; the company’s own lifetime average as the prior; absolute: 4.0★ = 0, 5★ = 100.Reliability (24%): How rarely jobs go badly: share of 1–2★ reviews — 60% the last 24 months (or the 20 newest if fewer), 40% all-time; 0% = 100, 15%+ = 0; the category percentile can only raise it.Craft & service (0%): Google review highlights: Quality, Professionalism, Responsiveness, Punctuality — how rarely reviewers flag them as a negative, per review since highlights began; 0% = 100, 5%+ = 0. Subtracted from the score (up to −10), never averaged in — clean highlights are the norm, not a bonus.Value (14%): Customers’ own price verdicts (Great / Reasonable vs Overpriced) and Value highlights; 65% absolute (all “reasonable” ≈ 80, “great” = 100), the category percentile can only raise it.Momentum (0%): Penalises only a real slide: last-12-month average below lifetime (−0.5★ = 0). Still 4.8★+ over the last year, or steady/improving = 100. Subtracted from the score (up to −10), never averaged in.Replies to reviews (7%): How often the owner publicly replies to reviews under 5★ (1–4★). Needs 3+ such reviews, otherwise not counted; 65% absolute (80%+ replied = 100), the category percentile can only raise it.One letter per factor score: A = 80+, B = 60–79, C = 40–59, D = 20–39, F = below 20. | ★Google star rating as shown on Google Maps. | Typical billMedian bill customers of this company reported in their reviews (needs 3+ priced reviews). |
|---|---|---|---|---|---|
| 1 |  Petite PupScottsdale, AZ | A 97How the Experts Score is calculatedEach factor is scored 0–100 on absolute terms (standing in the category can only raise it), then weighted; problems flagged in review highlights or a recent slide in ratings are subtracted:Satisfaction 59%98+57.5Reliability 26%95+24.8Value 15%100+15.2Craft & service penalty99−0.1Experts Score= 97Not enough data for replies to reviews; its weight is shared by the others.Grade A: A = 80+, B = 60–79, C = 40–59, D = 20–39. Needs 10+ reviews. | AAAAA– | 4.98 | — |
| 2 |  Memphis Childcare Academy (East Memphis)Memphis, TN | A 96How the Experts Score is calculatedEach factor is scored 0–100 on absolute terms (standing in the category can only raise it), then weighted; problems flagged in review highlights or a recent slide in ratings are subtracted:Satisfaction 59%97+56.9Reliability 26%93+24.3Value 15%100+15.2Experts Score= 96Not enough data for replies to reviews; its weight is shared by the others.Grade A: A = 80+, B = 60–79, C = 40–59, D = 20–39. Needs 10+ reviews. | AA–AA– | 5.00 | — |
| 3 |  Red Bridge Early Childhood CenterKansas City, MO | A 96How the Experts Score is calculatedEach factor is scored 0–100 on absolute terms (standing in the category can only raise it), then weighted; problems flagged in review highlights or a recent slide in ratings are subtracted:Satisfaction 69%97+67.2Reliability 31%93+28.6Experts Score= 96Not enough data for value, replies to reviews; its weight is shared by the others.Grade A: A = 80+, B = 60–79, C = 40–59, D = 20–39. Needs 10+ reviews. | AA––A– | 5.00 | — |
| 4 | The Goddard School of KirklandKirkland, WA | A 96How the Experts Score is calculatedEach factor is scored 0–100 on absolute terms (standing in the category can only raise it), then weighted; problems flagged in review highlights or a recent slide in ratings are subtracted:Satisfaction 59%99+58.1Reliability 26%97+25.3Value 15%81+12.3Craft & service penalty99−0.1Experts Score= 96Not enough data for replies to reviews; its weight is shared by the others.Grade A: A = 80+, B = 60–79, C = 40–59, D = 20–39. Needs 10+ reviews. | AAAAA– | 5.00 | — |
| 5 | 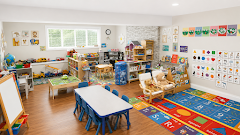 Seven Little Stars DaycareKirkland, WA | A 96How the Experts Score is calculatedEach factor is scored 0–100 on absolute terms (standing in the category can only raise it), then weighted; problems flagged in review highlights or a recent slide in ratings are subtracted:Satisfaction 59%97+56.9Reliability 26%93+24.3Value 15%100+15.2Experts Score= 96Not enough data for replies to reviews; its weight is shared by the others.Grade A: A = 80+, B = 60–79, C = 40–59, D = 20–39. Needs 10+ reviews. | AA–AA– | 5.00 | — |
| 6 |  Future Scholars Childcare and Learning CenterEl Paso, TX | A 96How the Experts Score is calculatedEach factor is scored 0–100 on absolute terms (standing in the category can only raise it), then weighted; problems flagged in review highlights or a recent slide in ratings are subtracted:Satisfaction 69%95+65.8Reliability 31%98+30.2Experts Score= 96Not enough data for value, replies to reviews; its weight is shared by the others.Grade A: A = 80+, B = 60–79, C = 40–59, D = 20–39. Needs 10+ reviews. | AA––A– | 4.95 | — |
| 7 | 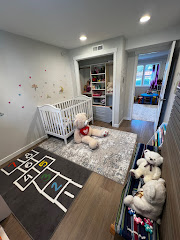 Little Elephant ChildcareKirkland, WA | A 94How the Experts Score is calculatedEach factor is scored 0–100 on absolute terms (standing in the category can only raise it), then weighted; problems flagged in review highlights or a recent slide in ratings are subtracted:Satisfaction 59%96+56.3Reliability 26%92+24Value 15%93+14.2Experts Score= 94Not enough data for replies to reviews; its weight is shared by the others.Grade A: A = 80+, B = 60–79, C = 40–59, D = 20–39. Needs 10+ reviews. | AA–AA– | 5.00 | — |
| 8 | A 94How the Experts Score is calculatedEach factor is scored 0–100 on absolute terms (standing in the category can only raise it), then weighted; problems flagged in review highlights or a recent slide in ratings are subtracted:Satisfaction 69%95+65.8Reliability 31%92+28.3Experts Score= 94Not enough data for value, replies to reviews; its weight is shared by the others.Grade A: A = 80+, B = 60–79, C = 40–59, D = 20–39. Needs 10+ reviews. | AA––A– | 5.00 | — | |
| 9 | KidzSpace Family ChildcareKirkland, WA | A 94How the Experts Score is calculatedEach factor is scored 0–100 on absolute terms (standing in the category can only raise it), then weighted; problems flagged in review highlights or a recent slide in ratings are subtracted:Satisfaction 59%95+55.8Reliability 26%92+24Value 15%96+14.6Experts Score= 94Not enough data for replies to reviews; its weight is shared by the others.Grade A: A = 80+, B = 60–79, C = 40–59, D = 20–39. Needs 10+ reviews. | AA–AA– | 5.00 | — |
| 10 | A 94How the Experts Score is calculatedEach factor is scored 0–100 on absolute terms (standing in the category can only raise it), then weighted; problems flagged in review highlights or a recent slide in ratings are subtracted:Satisfaction 69%95+65.8Reliability 31%92+28.3Experts Score= 94Not enough data for value, replies to reviews; its weight is shared by the others.Grade A: A = 80+, B = 60–79, C = 40–59, D = 20–39. Needs 10+ reviews. | AA––A– | 5.00 | — | |
| 11 |  Dolphin Child AcademyKirkland, WA | A 93How the Experts Score is calculatedEach factor is scored 0–100 on absolute terms (standing in the category can only raise it), then weighted; problems flagged in review highlights or a recent slide in ratings are subtracted:Satisfaction 59%98+57.5Reliability 26%96+25Value 15%69+10.5Experts Score= 93Not enough data for replies to reviews; its weight is shared by the others.Grade A: A = 80+, B = 60–79, C = 40–59, D = 20–39. Needs 10+ reviews. | AA–BA– | 5.00 | — |
| 12 | Evergreen Child Care llcKirkland, WA | A 93How the Experts Score is calculatedEach factor is scored 0–100 on absolute terms (standing in the category can only raise it), then weighted; problems flagged in review highlights or a recent slide in ratings are subtracted:Satisfaction 59%97+56.9Reliability 26%93+24.3Value 15%82+12.5Craft & service penalty98−0.2Experts Score= 93Not enough data for replies to reviews; its weight is shared by the others.Grade A: A = 80+, B = 60–79, C = 40–59, D = 20–39. Needs 10+ reviews. | AAAAA– | 5.00 | — |
What jobs cost
What customers paid, from the price Google asks reviewers to report.
| Job | Low25th percentile: 1 in 4 customers paid less than this. | TypicalMedian of the bill customers reported in their Google review (Google asks reviewers for a price range; we use the middle of each range). | High75th percentile: 1 in 4 customers paid more than this. | FairOf customers who rated the price, the share who chose “Great price” or “Reasonable” rather than “Overpriced”. |
|---|
Daycare Centers at a glance
How the 80 daycare centers we rated compare, and what customers praise most.
Experts Score grades
A = score 80+, F = below 20.
- Grade A4151%
- Grade B3240%
- Grade C79%
- Grade D00%
- Grade F00%
Google ratings
Average stars per company.
- 4.90★ and up2430%
- 4.80–4.89★2329%
- 4.60–4.79★2936%
- Below 4.60★45%
What customers praise
Share of Google review highlights.
- Quality29227%
- Professionalism29928%
- Responsiveness24623%
- Punctuality111%
- Value23922%
Was the price fair?
All price verdicts left with reviews.
- Great price21349%
- Reasonable20948%
- Overpriced61%
- Not sure82%
Price verdicts by year
Share calling it great / reasonable / overpriced.
How we grade
Satisfaction (54%) — Recency-weighted star average (2-year half-life), shrunk toward the category mean by review volume; the company’s own lifetime average as the prior; absolute: 4.0★ = 0, 5★ = 100.
Reliability (24%) — How rarely jobs go badly: share of 1–2★ reviews — 60% the last 24 months (or the 20 newest if fewer), 40% all-time; 0% = 100, 15%+ = 0; the category percentile can only raise it.
Craft & service (penalty, up to −10) — Google review highlights: Quality, Professionalism, Responsiveness, Punctuality — how rarely reviewers flag them as a negative, per review since highlights began; 0% = 100, 5%+ = 0. Subtracted from the score (up to −10), never averaged in — clean highlights are the norm, not a bonus.
Value (14%) — Customers’ own price verdicts (Great / Reasonable vs Overpriced) and Value highlights; 65% absolute (all “reasonable” ≈ 80, “great” = 100), the category percentile can only raise it.
Momentum (penalty, up to −10) — Penalises only a real slide: last-12-month average below lifetime (−0.5★ = 0). Still 4.8★+ over the last year, or steady/improving = 100. Subtracted from the score (up to −10), never averaged in.
Replies to reviews (7%) — How often the owner publicly replies to reviews under 5★ (1–4★). Needs 3+ such reviews, otherwise not counted; 65% absolute (80%+ replied = 100), the category percentile can only raise it.