
The Best Event Entertainment
We graded 26 companies on seven things customers actually report: satisfaction, reliability, workmanship, value, momentum, track record and how owners handle complaints.
From 8,500 Google reviews of 26 top-rated event entertainment nationwide. Updated October 29, 2026.
Find the right company for your job
Pick the job — we re-rank companies by how customers rated that exact job.
Best event entertainment for private tours
Clear ✕ Watson Adventures Scavenger HuntsHow Job match is calculatedBuilt only from reviews Google tagged “Private tours”:Stars on this job 55%5.00★Number of such jobs 25%31Overall Experts Score 20%95Job match= 96Stars are pulled toward the category average (4.83★) when a company has few tagged jobs, so 3 perfect reviews don’t beat 80 great ones. 4.3★ scores 0, 5.0★ scores full. Volume is compared with the busiest company for this job.96
Job match = this company’s ★ on reviews Google tagged “Private tours” (shrunk toward the category average when there are few), how many such jobs it has done, and its overall Experts Score.
What customers said about private tours
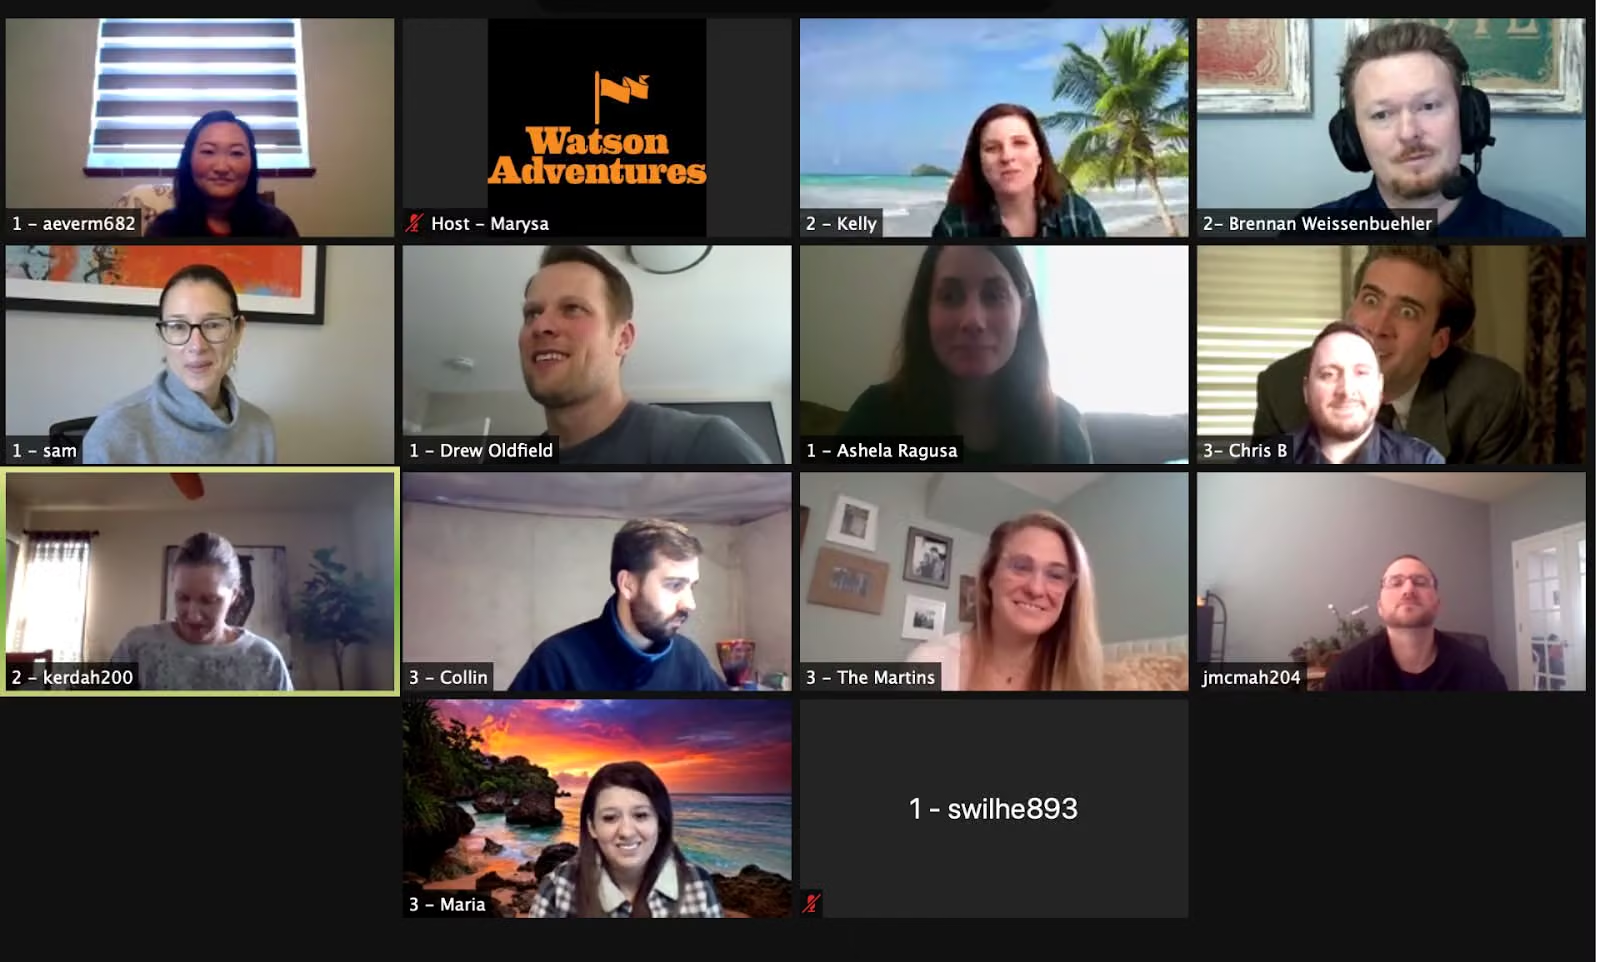
Watson Adventures Scavenger HuntsWatson Adventures hosted a private scavenger hunt for my org and it was really well done. Our host Zach did a great job, was very funny, and could definitely read the room. As an event planner myself I have high expectations for the way things like this are executed and I would definitely recommend Watson Adventures…
Watson Adventures Scavenger HuntsOur Finance Team went on a virtual scavenger hunt around the world. Everyone had a great time, and it was nice to do some remote travelling after a year a half of working remotely. Christine was very pleasant and professional to deal with when we were setting up this event, and Joshua was an exceptional and very…
Watson Adventures Scavenger HuntsWe used Watson Adventures for a corporate team building private puzzle hunt. The event was a total success. Our host, Tokia, was fantastic: high-energy, knowledgeable and personable. She really made the experience for us. In terms of coordinating with Watson (particularly the technology piece), the process was…
Watson Adventures Scavenger HuntsWe had a blast at Jonah's 11th birthday party on Governor's Island. The Watson Adventure Team was speedy to respond, easy to work with. Our host Shannon was AWESOME and the 16 kids on the hunt had a blast. The game developmentally matched what they could handle. What a unique and fun party. Thanks Watson!
Watson Adventures Scavenger HuntsWe did a private Greenwich Village Scavenger hunt with 3 families. Every age from 10 years old to 57 absolutely loved it. Andy, our guide, was enthusiastic, helpful and just great to be around. Highly highly recommend for a unique NYC experience.
Watson Adventures Scavenger HuntsWe used Watson Adventures for a work outing for a team of 15 and it was really awesome! When we are all in a virtual space and unable to have traditional outings where we're all together in person, this was a really nice alternative that still felt really meaningful where team building happened. Our scavenger hunt…
Overall ratings
Experts Score 0–100Experts Score (0–100)Absolute quality first: recency-weighted star average (≈54%), share of 1–2★ reviews (≈24%), customers’ price verdicts (≈14%), owner replies to critical reviews (≈7%); minus up to 10 points each for complaints flagged in Google review highlights and for a real slide in recent ratings. Hover a company’s score on its page for the full breakdown. and a letter grade per factor (A = top 20% of event entertainment).
| # | Company | ScoreExperts Score (0–100)Absolute quality first: recency-weighted star average (≈54%), share of 1–2★ reviews (≈24%), customers’ price verdicts (≈14%), owner replies to critical reviews (≈7%); minus up to 10 points each for complaints flagged in Google review highlights and for a real slide in recent ratings. Hover a company’s score on its page for the full breakdown. | FactorsFactor grades, in orderSatisfaction (54%): Recency-weighted star average (2-year half-life), shrunk toward the category mean by review volume; the company’s own lifetime average as the prior; absolute: 4.0★ = 0, 5★ = 100.Reliability (24%): How rarely jobs go badly: share of 1–2★ reviews — 60% the last 24 months (or the 20 newest if fewer), 40% all-time; 0% = 100, 15%+ = 0; the category percentile can only raise it.Craft & service (0%): Google review highlights: Quality, Professionalism, Responsiveness, Punctuality — how rarely reviewers flag them as a negative, per review since highlights began; 0% = 100, 5%+ = 0. Subtracted from the score (up to −10), never averaged in — clean highlights are the norm, not a bonus.Value (14%): Customers’ own price verdicts (Great / Reasonable vs Overpriced) and Value highlights; 65% absolute (all “reasonable” ≈ 80, “great” = 100), the category percentile can only raise it.Momentum (0%): Penalises only a real slide: last-12-month average below lifetime (−0.5★ = 0). Still 4.8★+ over the last year, or steady/improving = 100. Subtracted from the score (up to −10), never averaged in.Replies to reviews (7%): How often the owner publicly replies to reviews under 5★ (1–4★). Needs 3+ such reviews, otherwise not counted; 65% absolute (80%+ replied = 100), the category percentile can only raise it.One letter per factor score: A = 80+, B = 60–79, C = 40–59, D = 20–39, F = below 20. | ★Google star rating as shown on Google Maps. | Typical billMedian bill customers of this company reported in their reviews (needs 3+ priced reviews). |
|---|---|---|---|---|---|
| 1 |  LASER SHOW USA CorpNew York, NY | A 100How the Experts Score is calculatedEach factor is scored 0–100 on absolute terms (standing in the category can only raise it), then weighted; problems flagged in review highlights or a recent slide in ratings are subtracted:Satisfaction 59%100+58.7Reliability 26%99+25.8Value 15%100+15.2Experts Score= 100Not enough data for replies to reviews; its weight is shared by the others.Grade A: A = 80+, B = 60–79, C = 40–59, D = 20–39. Needs 10+ reviews. | AAAAA– | 4.99 | — |
| 2 |  Elegant SceneryPflugerville, TX | A 98How the Experts Score is calculatedEach factor is scored 0–100 on absolute terms (standing in the category can only raise it), then weighted; problems flagged in review highlights or a recent slide in ratings are subtracted:Satisfaction 59%98+57.5Reliability 26%96+25Value 15%100+15.2Experts Score= 98Not enough data for replies to reviews; its weight is shared by the others.Grade A: A = 80+, B = 60–79, C = 40–59, D = 20–39. Needs 10+ reviews. | AA–AA– | 5.00 | — |
| 3 |  Bizzy Bee Entertainment and Events LLCPflugerville, TX | A 98How the Experts Score is calculatedEach factor is scored 0–100 on absolute terms (standing in the category can only raise it), then weighted; problems flagged in review highlights or a recent slide in ratings are subtracted:Satisfaction 59%99+58.1Reliability 26%97+25.3Value 15%99+15.1Experts Score= 98Not enough data for replies to reviews; its weight is shared by the others.Grade A: A = 80+, B = 60–79, C = 40–59, D = 20–39. Needs 10+ reviews. | AAAAA– | 5.00 | — |
| 4 |  Party HeadphonesNew York, NY | A 98How the Experts Score is calculatedEach factor is scored 0–100 on absolute terms (standing in the category can only raise it), then weighted; problems flagged in review highlights or a recent slide in ratings are subtracted:Satisfaction 69%97+67.2Reliability 31%99+30.5Experts Score= 98Not enough data for value, replies to reviews; its weight is shared by the others.Grade A: A = 80+, B = 60–79, C = 40–59, D = 20–39. Needs 10+ reviews. | AA––A– | 4.98 | — |
| 5 |  Ello EntertainmentNew York, NY | A 98How the Experts Score is calculatedEach factor is scored 0–100 on absolute terms (standing in the category can only raise it), then weighted; problems flagged in review highlights or a recent slide in ratings are subtracted:Satisfaction 69%99+68.5Reliability 31%97+29.8Experts Score= 98Not enough data for value, replies to reviews; its weight is shared by the others.Grade A: A = 80+, B = 60–79, C = 40–59, D = 20–39. Needs 10+ reviews. | AA––A– | 5.00 | — |
| 6 | 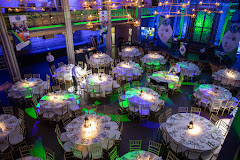 AYZA Private Party EventsNew York, NY | A 98How the Experts Score is calculatedEach factor is scored 0–100 on absolute terms (standing in the category can only raise it), then weighted; problems flagged in review highlights or a recent slide in ratings are subtracted:Satisfaction 69%98+67.8Reliability 31%98+30.2Experts Score= 98Not enough data for value, replies to reviews; its weight is shared by the others.Grade A: A = 80+, B = 60–79, C = 40–59, D = 20–39. Needs 10+ reviews. | AA––A– | 4.98 | — |
| 7 | Party ZonePaterson, NJ | A 98How the Experts Score is calculatedEach factor is scored 0–100 on absolute terms (standing in the category can only raise it), then weighted; problems flagged in review highlights or a recent slide in ratings are subtracted:Satisfaction 59%98+57.5Reliability 26%96+25Value 15%100+15.2Experts Score= 98Not enough data for replies to reviews; its weight is shared by the others.Grade A: A = 80+, B = 60–79, C = 40–59, D = 20–39. Needs 10+ reviews. | AA–AA– | 5.00 | — |
| 8 |  Porcci NYCNew York, NY | A 97How the Experts Score is calculatedEach factor is scored 0–100 on absolute terms (standing in the category can only raise it), then weighted; problems flagged in review highlights or a recent slide in ratings are subtracted:Satisfaction 69%98+67.8Reliability 31%95+29.2Experts Score= 97Not enough data for value, replies to reviews; its weight is shared by the others.Grade A: A = 80+, B = 60–79, C = 40–59, D = 20–39. Needs 10+ reviews. | AA––A– | 4.96 | — |
| 9 |  Vision Event Co.New York, NY | A 97How the Experts Score is calculatedEach factor is scored 0–100 on absolute terms (standing in the category can only raise it), then weighted; problems flagged in review highlights or a recent slide in ratings are subtracted:Satisfaction 59%98+57.5Reliability 26%96+25Value 15%94+14.3Experts Score= 97Not enough data for replies to reviews; its weight is shared by the others.Grade A: A = 80+, B = 60–79, C = 40–59, D = 20–39. Needs 10+ reviews. | AAAAA– | 5.00 | — |
| 10 |  Ripe Records Studio / Ripe Event HallPaterson, NJ | A 97How the Experts Score is calculatedEach factor is scored 0–100 on absolute terms (standing in the category can only raise it), then weighted; problems flagged in review highlights or a recent slide in ratings are subtracted:Satisfaction 69%97+67.2Reliability 31%97+29.8Experts Score= 97Not enough data for value, replies to reviews; its weight is shared by the others.Grade A: A = 80+, B = 60–79, C = 40–59, D = 20–39. Needs 10+ reviews. | AA––A– | 4.97 | — |
| 11 |  On The Move EntertainmentNew York, NY | A 96How the Experts Score is calculatedEach factor is scored 0–100 on absolute terms (standing in the category can only raise it), then weighted; problems flagged in review highlights or a recent slide in ratings are subtracted:Satisfaction 69%97+67.2Reliability 31%94+28.9Experts Score= 96Not enough data for value, replies to reviews; its weight is shared by the others.Grade A: A = 80+, B = 60–79, C = 40–59, D = 20–39. Needs 10+ reviews. | AA––A– | 4.96 | — |
| 12 | 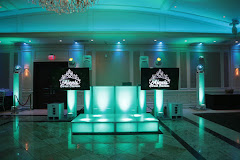 Epic Events Wedding & Event GroupPaterson, NJ | A 96How the Experts Score is calculatedEach factor is scored 0–100 on absolute terms (standing in the category can only raise it), then weighted; problems flagged in review highlights or a recent slide in ratings are subtracted:Satisfaction 69%96+66.5Reliability 31%96+29.5Experts Score= 96Not enough data for value, replies to reviews; its weight is shared by the others.Grade A: A = 80+, B = 60–79, C = 40–59, D = 20–39. Needs 10+ reviews. | AAA––– | 5.00 | — |
What jobs cost
What customers paid, from the price Google asks reviewers to report.
| Job | Low25th percentile: 1 in 4 customers paid less than this. | TypicalMedian of the bill customers reported in their Google review (Google asks reviewers for a price range; we use the middle of each range). | High75th percentile: 1 in 4 customers paid more than this. | FairOf customers who rated the price, the share who chose “Great price” or “Reasonable” rather than “Overpriced”. |
|---|
Event Entertainment at a glance
How the 26 event entertainment we rated compare, and what customers praise most.
Experts Score grades
A = score 80+, F = below 20.
- Grade A2077%
- Grade B519%
- Grade C14%
- Grade D00%
- Grade F00%
Google ratings
Average stars per company.
- 4.90★ and up1869%
- 4.80–4.89★28%
- 4.60–4.79★312%
- Below 4.60★312%
What customers praise
Share of Google review highlights.
- Quality16627%
- Professionalism16928%
- Responsiveness8614%
- Punctuality5910%
- Value13322%
Was the price fair?
All price verdicts left with reviews.
- Great price2140%
- Reasonable2955%
- Overpriced00%
- Not sure36%
Price verdicts by year
Share calling it great / reasonable / overpriced.
How we grade
Satisfaction (54%) — Recency-weighted star average (2-year half-life), shrunk toward the category mean by review volume; the company’s own lifetime average as the prior; absolute: 4.0★ = 0, 5★ = 100.
Reliability (24%) — How rarely jobs go badly: share of 1–2★ reviews — 60% the last 24 months (or the 20 newest if fewer), 40% all-time; 0% = 100, 15%+ = 0; the category percentile can only raise it.
Craft & service (penalty, up to −10) — Google review highlights: Quality, Professionalism, Responsiveness, Punctuality — how rarely reviewers flag them as a negative, per review since highlights began; 0% = 100, 5%+ = 0. Subtracted from the score (up to −10), never averaged in — clean highlights are the norm, not a bonus.
Value (14%) — Customers’ own price verdicts (Great / Reasonable vs Overpriced) and Value highlights; 65% absolute (all “reasonable” ≈ 80, “great” = 100), the category percentile can only raise it.
Momentum (penalty, up to −10) — Penalises only a real slide: last-12-month average below lifetime (−0.5★ = 0). Still 4.8★+ over the last year, or steady/improving = 100. Subtracted from the score (up to −10), never averaged in.
Replies to reviews (7%) — How often the owner publicly replies to reviews under 5★ (1–4★). Needs 3+ such reviews, otherwise not counted; 65% absolute (80%+ replied = 100), the category percentile can only raise it.