
The Best Home Staging Services in Camden, NJ
We graded 5 companies on seven things customers actually report: satisfaction, reliability, workmanship, value, momentum, track record and how owners handle complaints.
From 13,799 Google reviews of 124 top-rated home staging services nationwide; 5 of them in Camden, NJ. Updated November 2, 2026.
Find the right company for your job
Pick the job — we re-rank companies by how customers rated that exact job.
Best home staging services in Camden for bedroom design
Clear ✕ FDG InteriorsHow Job match is calculatedBuilt only from reviews Google tagged “Bedroom design”:Stars on this job 55%5.00★Number of such jobs 25%4Overall Experts Score 20%96Job match= 95Stars are pulled toward the category average (4.92★) when a company has few tagged jobs, so 3 perfect reviews don’t beat 80 great ones. 4.3★ scores 0, 5.0★ scores full. Volume is compared with the busiest company for this job.95
Job match = this company’s ★ on reviews Google tagged “Bedroom design” (shrunk toward the category average when there are few), how many such jobs it has done, and its overall Experts Score.
What customers said about bedroom design
FDG InteriorsCindy did an amazing job transforming my entire house from initial design through selection of furniture, lighting, drapes, carpeting and paint/color selection. I continue to get compliments from people visiting my house as a result of her work.
FDG InteriorsHello my name is Jessica I used Cindy to remodel my entire basement. I have been so impressed with her creativity, inspiring design and her exceptional standards. I let Cindy know what I was trying to do, which was having an in home daycare. As you can see through pictures that I have provided, you would not think…
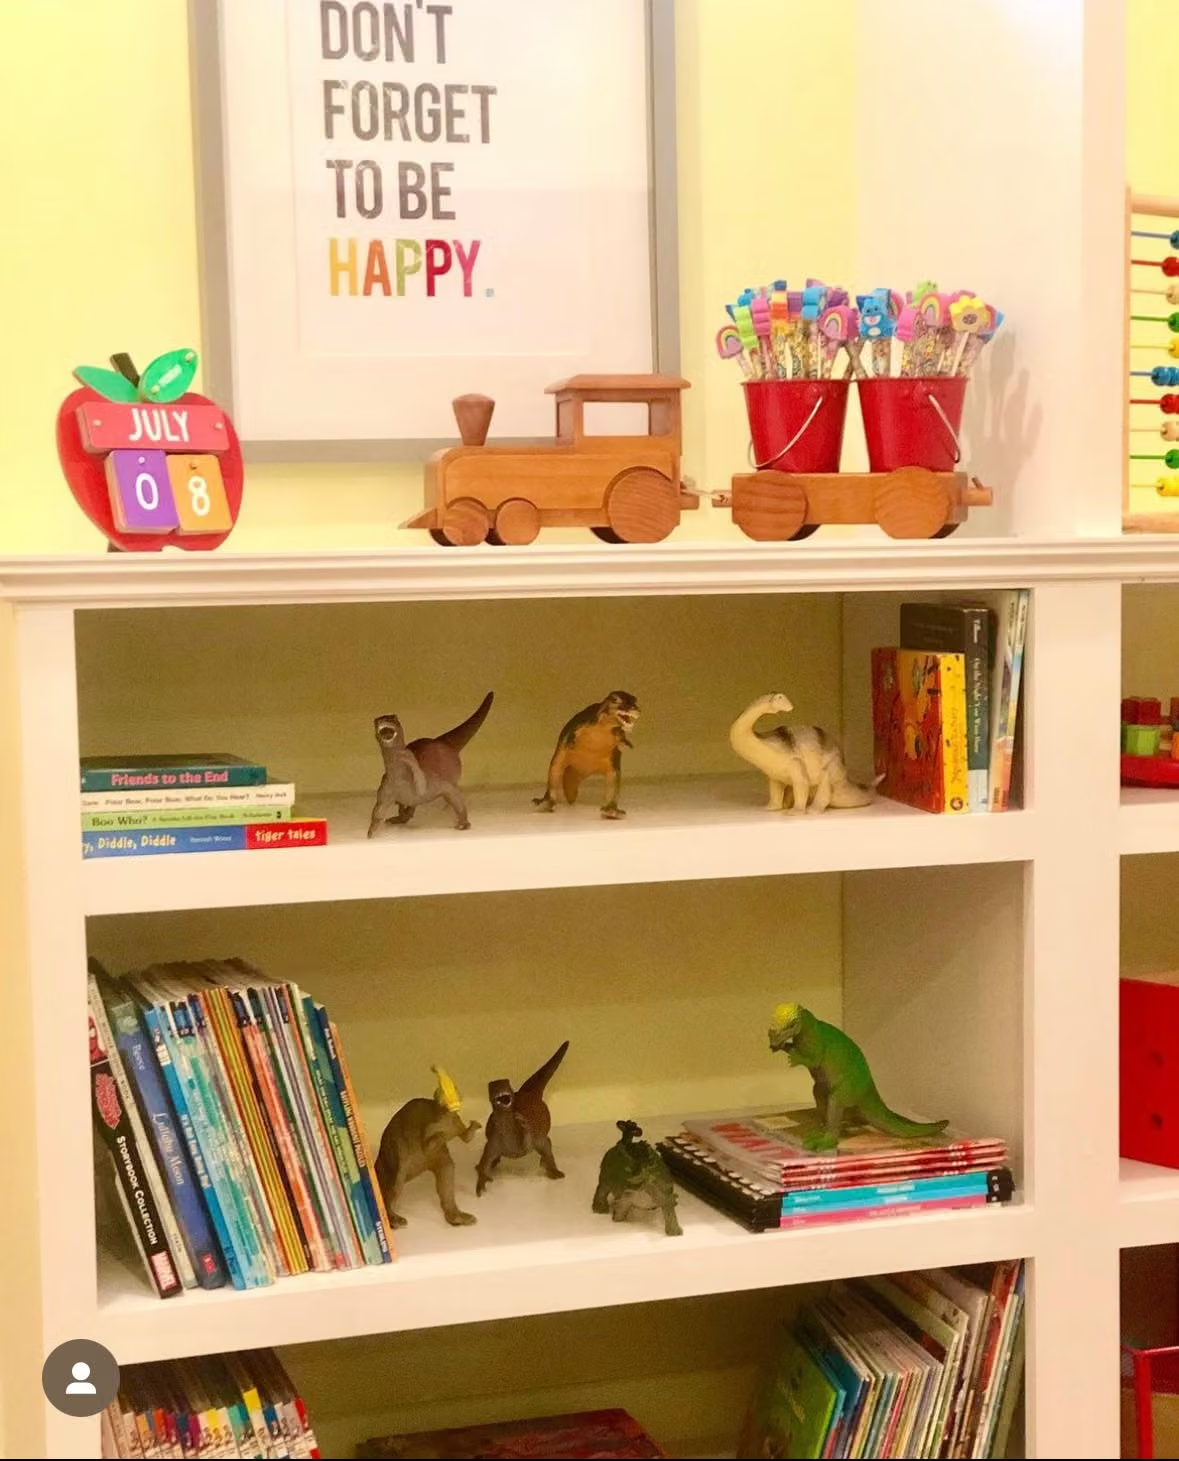
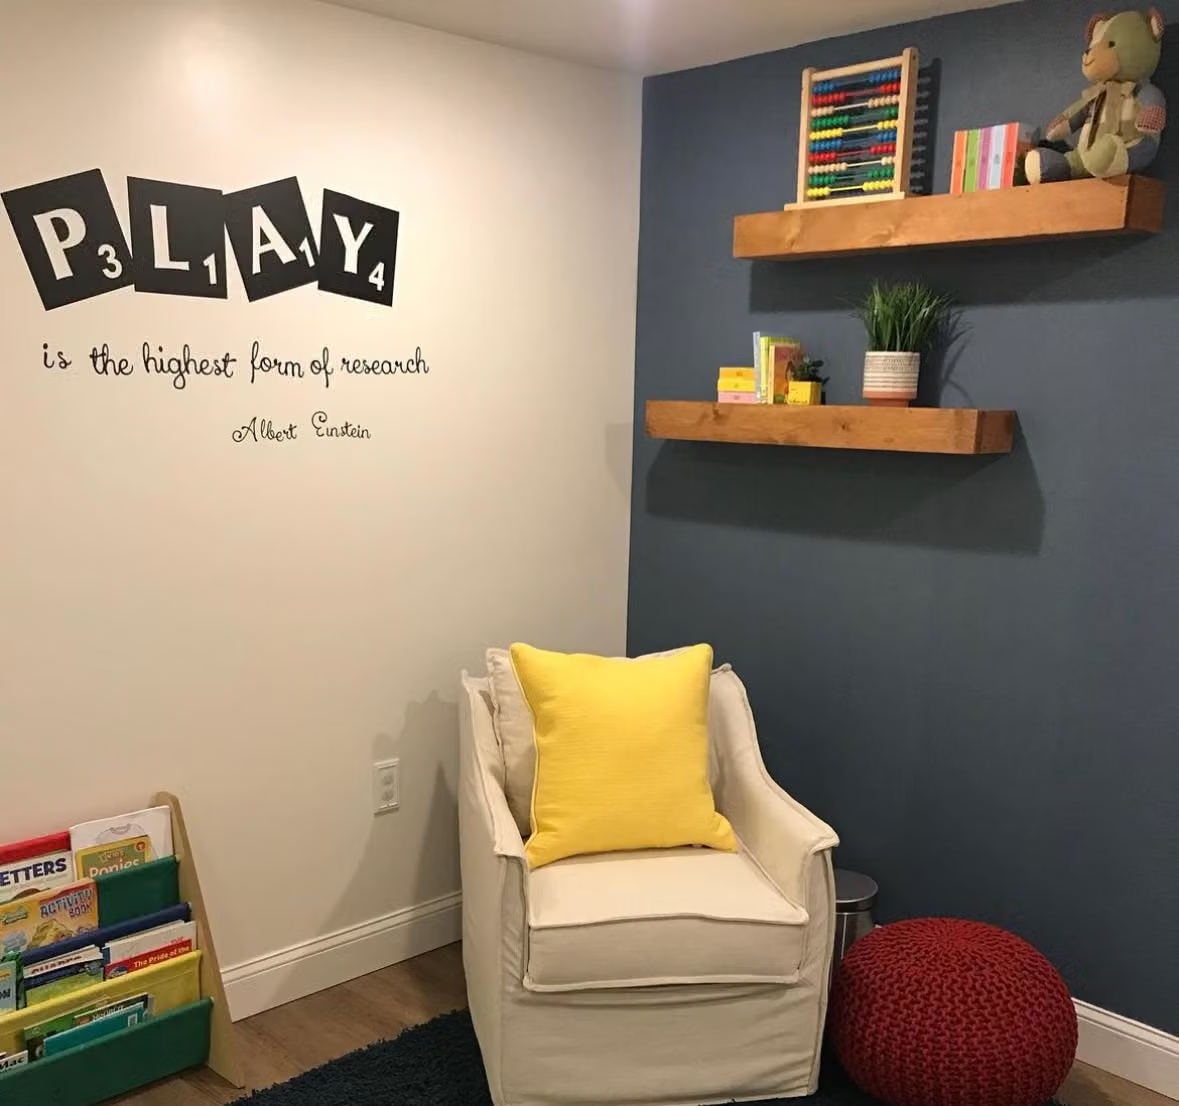
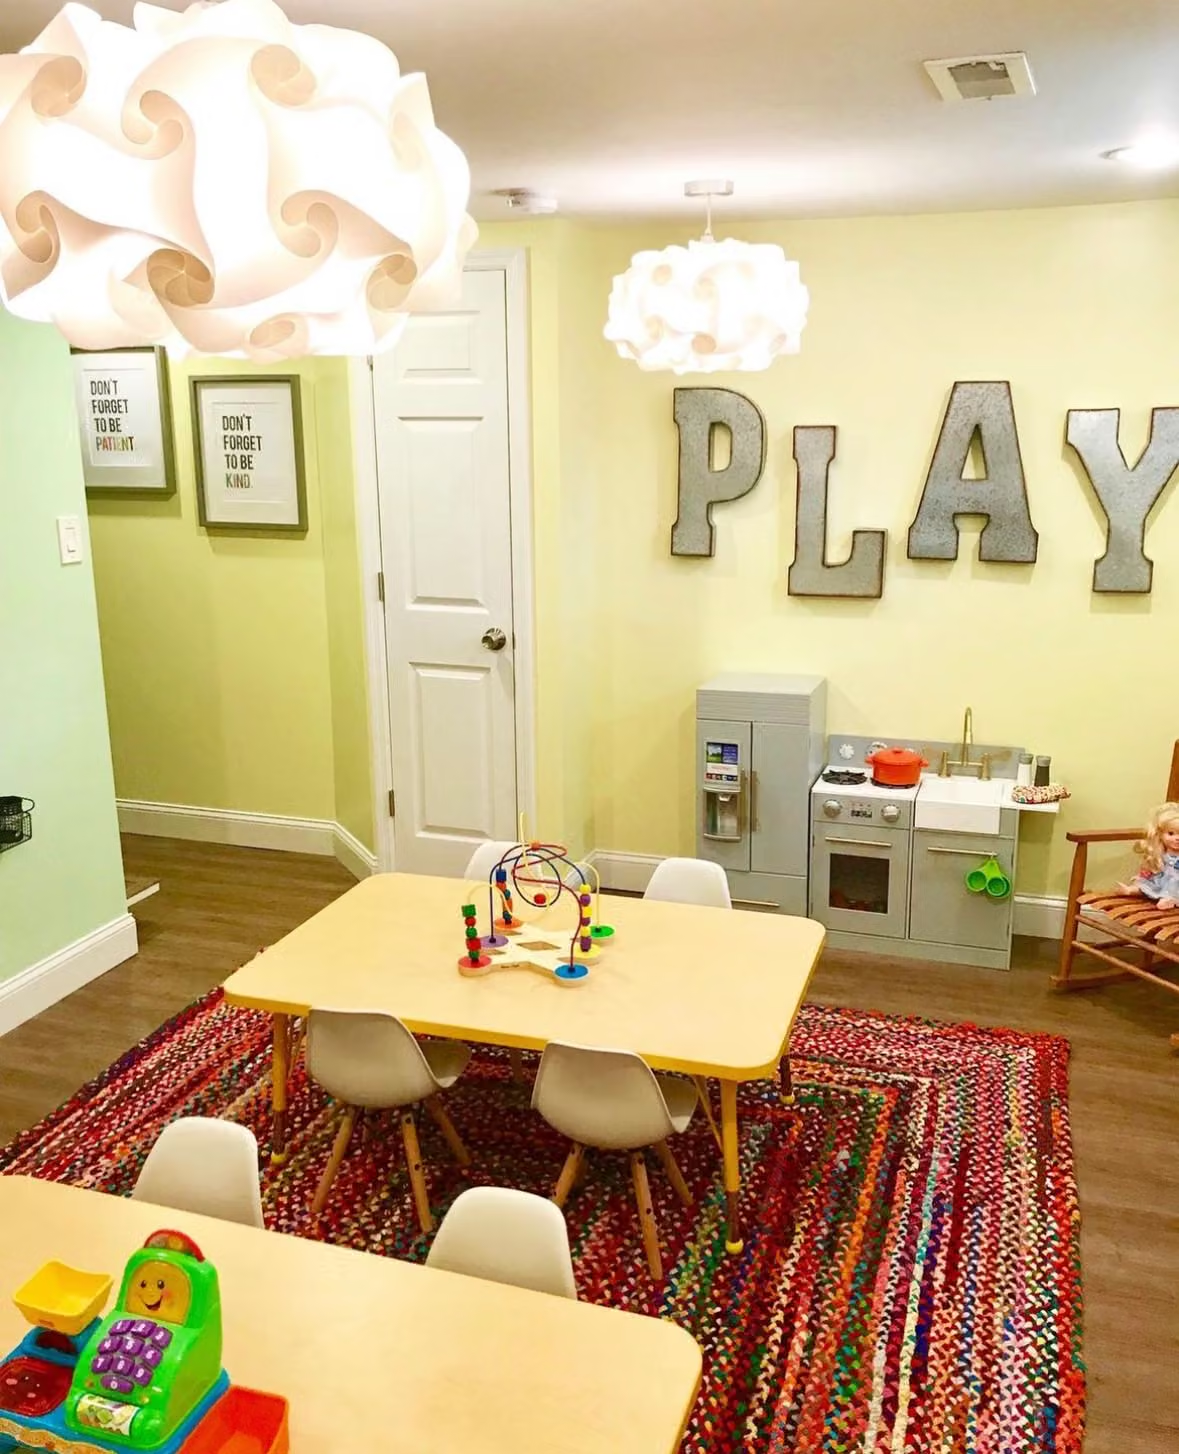 FDG Interiors
I honestly cannot say enough about Cindy and the services she has provided for my home. I am currently inheriting a house from my late parents which is both a time capsule and mid 70's shrine. I have hired FDG Interiors to assist me with applying an entire make-over to the house. Cindy has been attentive to my needs…
FDG InteriorsI have worked with Cindy of Fetterman Design Group and have first hand experienced her talent and process! She keeps you updated, she is extremely responsive and always positive! A pleasure to work with and I highly recommend her for any and all interior design needs!
Overall ratings
Experts Score 0–100Experts Score (0–100)Absolute quality first: recency-weighted star average (≈54%), share of 1–2★ reviews (≈24%), customers’ price verdicts (≈14%), owner replies to critical reviews (≈7%); minus up to 10 points each for complaints flagged in Google review highlights and for a real slide in recent ratings. Hover a company’s score on its page for the full breakdown. and a letter grade per factor (A = top 20% of home staging services).
| # | Company | ScoreExperts Score (0–100)Absolute quality first: recency-weighted star average (≈54%), share of 1–2★ reviews (≈24%), customers’ price verdicts (≈14%), owner replies to critical reviews (≈7%); minus up to 10 points each for complaints flagged in Google review highlights and for a real slide in recent ratings. Hover a company’s score on its page for the full breakdown. | FactorsFactor grades, in orderSatisfaction (54%): Recency-weighted star average (2-year half-life), shrunk toward the category mean by review volume; the company’s own lifetime average as the prior; absolute: 4.0★ = 0, 5★ = 100.Reliability (24%): How rarely jobs go badly: share of 1–2★ reviews — 60% the last 24 months (or the 20 newest if fewer), 40% all-time; 0% = 100, 15%+ = 0; the category percentile can only raise it.Craft & service (0%): Google review highlights: Quality, Professionalism, Responsiveness, Punctuality — how rarely reviewers flag them as a negative, per review since highlights began; 0% = 100, 5%+ = 0. Subtracted from the score (up to −10), never averaged in — clean highlights are the norm, not a bonus.Value (14%): Customers’ own price verdicts (Great / Reasonable vs Overpriced) and Value highlights; 65% absolute (all “reasonable” ≈ 80, “great” = 100), the category percentile can only raise it.Momentum (0%): Penalises only a real slide: last-12-month average below lifetime (−0.5★ = 0). Still 4.8★+ over the last year, or steady/improving = 100. Subtracted from the score (up to −10), never averaged in.Replies to reviews (7%): How often the owner publicly replies to reviews under 5★ (1–4★). Needs 3+ such reviews, otherwise not counted; 65% absolute (80%+ replied = 100), the category percentile can only raise it.One letter per factor score: A = 80+, B = 60–79, C = 40–59, D = 20–39, F = below 20. | ★Google star rating as shown on Google Maps. | Typical billMedian bill customers of this company reported in their reviews (needs 3+ priced reviews). |
|---|---|---|---|---|---|
| 1 |  South Jersey Homes & StagingCamden, NJ | A 98How the Experts Score is calculatedEach factor is scored 0–100 on absolute terms (standing in the category can only raise it), then weighted; problems flagged in review highlights or a recent slide in ratings are subtracted:Satisfaction 69%99+68.5Reliability 31%97+29.8Experts Score= 98Not enough data for value, replies to reviews; its weight is shared by the others.Grade A: A = 80+, B = 60–79, C = 40–59, D = 20–39. Needs 10+ reviews. | AA––A– | 5.00 | — |
| 2 |  Stellar Stagings & RedesignsCamden, NJ | A 97How the Experts Score is calculatedEach factor is scored 0–100 on absolute terms (standing in the category can only raise it), then weighted; problems flagged in review highlights or a recent slide in ratings are subtracted:Satisfaction 59%98+57.5Reliability 26%97+25.3Value 15%95+14.5Craft & service penalty98−0.2Experts Score= 97Not enough data for replies to reviews; its weight is shared by the others.Grade A: A = 80+, B = 60–79, C = 40–59, D = 20–39. Needs 10+ reviews. | AAAAA– | 5.00 | — |
| 3 | FDG InteriorsCamden, NJ | A 96How the Experts Score is calculatedEach factor is scored 0–100 on absolute terms (standing in the category can only raise it), then weighted; problems flagged in review highlights or a recent slide in ratings are subtracted:Satisfaction 59%99+58.1Reliability 26%97+25.3Value 15%83+12.6Craft & service penalty99−0.1Experts Score= 96Not enough data for replies to reviews; its weight is shared by the others.Grade A: A = 80+, B = 60–79, C = 40–59, D = 20–39. Needs 10+ reviews. | AAAAA– | 5.00 | — |
| 4 |  Design Studio 312, LLCCamden, NJ | A 88How the Experts Score is calculatedEach factor is scored 0–100 on absolute terms (standing in the category can only raise it), then weighted; problems flagged in review highlights or a recent slide in ratings are subtracted:Satisfaction 59%89+52.2Reliability 26%79+20.6Value 15%100+15.2Craft & service penalty99−0.1Experts Score= 88Not enough data for replies to reviews; its weight is shared by the others.Grade A: A = 80+, B = 60–79, C = 40–59, D = 20–39. Needs 10+ reviews. | ABAA–– | 4.89 | — |
| 5 |  Vibrant Staging & Design LLC • Home Staging • Interior DesignCamden, NJ | B 74How the Experts Score is calculatedEach factor is scored 0–100 on absolute terms (standing in the category can only raise it), then weighted; problems flagged in review highlights or a recent slide in ratings are subtracted:Satisfaction 69%80+55.4Reliability 31%75+23.1Momentum penalty57−4.3Experts Score= 74Not enough data for value, replies to reviews; its weight is shared by the others.Grade B: A = 80+, B = 60–79, C = 40–59, D = 20–39. Needs 10+ reviews. | AB––C– | 4.83 | — |
What jobs cost
What customers paid, from the price Google asks reviewers to report.
| Job | Low25th percentile: 1 in 4 customers paid less than this. | TypicalMedian of the bill customers reported in their Google review (Google asks reviewers for a price range; we use the middle of each range). | High75th percentile: 1 in 4 customers paid more than this. | FairOf customers who rated the price, the share who chose “Great price” or “Reasonable” rather than “Overpriced”. |
|---|
Home Staging Services in Camden, NJ at a glance
How the 5 home staging services we rated in Camden, NJ compare, and what customers praise most.
Experts Score grades
A = score 80+, F = below 20.
- Grade A480%
- Grade B120%
- Grade C00%
- Grade D00%
- Grade F00%
Google ratings
Average stars per company.
- 4.90★ and up360%
- 4.80–4.89★240%
- 4.60–4.79★00%
- Below 4.60★00%
What customers praise
Share of Google review highlights.
- Quality1,41622%
- Professionalism1,73527%
- Responsiveness1,56024%
- Punctuality5268%
- Value1,14118%
Was the price fair?
All price verdicts left with reviews.
Not enough data yet.
Price verdicts by year
Share calling it great / reasonable / overpriced.
How we grade
Satisfaction (54%) — Recency-weighted star average (2-year half-life), shrunk toward the category mean by review volume; the company’s own lifetime average as the prior; absolute: 4.0★ = 0, 5★ = 100.
Reliability (24%) — How rarely jobs go badly: share of 1–2★ reviews — 60% the last 24 months (or the 20 newest if fewer), 40% all-time; 0% = 100, 15%+ = 0; the category percentile can only raise it.
Craft & service (penalty, up to −10) — Google review highlights: Quality, Professionalism, Responsiveness, Punctuality — how rarely reviewers flag them as a negative, per review since highlights began; 0% = 100, 5%+ = 0. Subtracted from the score (up to −10), never averaged in — clean highlights are the norm, not a bonus.
Value (14%) — Customers’ own price verdicts (Great / Reasonable vs Overpriced) and Value highlights; 65% absolute (all “reasonable” ≈ 80, “great” = 100), the category percentile can only raise it.
Momentum (penalty, up to −10) — Penalises only a real slide: last-12-month average below lifetime (−0.5★ = 0). Still 4.8★+ over the last year, or steady/improving = 100. Subtracted from the score (up to −10), never averaged in.
Replies to reviews (7%) — How often the owner publicly replies to reviews under 5★ (1–4★). Needs 3+ such reviews, otherwise not counted; 65% absolute (80%+ replied = 100), the category percentile can only raise it.