
The Best Leak Detection Services in Speedway, IN
We graded 8 companies on seven things customers actually report: satisfaction, reliability, workmanship, value, momentum, track record and how owners handle complaints.
From 44,057 Google reviews of 44 top-rated leak detection services nationwide; 8 of them in Speedway, IN. Updated November 5, 2026.
Find the right company for your job
Pick the job — we re-rank companies by how customers rated that exact job.
Best leak detection services in Speedway for faucet installation
Clear ✕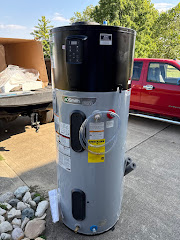 Grey Plumbing Inc.How Job match is calculatedBuilt only from reviews Google tagged “Faucet installation”:Stars on this job 55%5.00★Number of such jobs 25%29Overall Experts Score 20%92Job match= 90Stars are pulled toward the category average (4.89★) when a company has few tagged jobs, so 3 perfect reviews don’t beat 80 great ones. 4.3★ scores 0, 5.0★ scores full. Volume is compared with the busiest company for this job.90
 Dutton Plumbing, Inc.How Job match is calculatedBuilt only from reviews Google tagged “Faucet installation”:Stars on this job 55%5.00★Number of such jobs 25%21Overall Experts Score 20%85Job match= 87Stars are pulled toward the category average (4.89★) when a company has few tagged jobs, so 3 perfect reviews don’t beat 80 great ones. 4.3★ scores 0, 5.0★ scores full. Volume is compared with the busiest company for this job.87
 Carter's My PlumberHow Job match is calculatedBuilt only from reviews Google tagged “Faucet installation”:Stars on this job 55%4.94★Number of such jobs 25%18Overall Experts Score 20%92Job match= 84Stars are pulled toward the category average (4.89★) when a company has few tagged jobs, so 3 perfect reviews don’t beat 80 great ones. 4.3★ scores 0, 5.0★ scores full. Volume is compared with the busiest company for this job.84
 Carter's My PlumberHow Job match is calculatedBuilt only from reviews Google tagged “Faucet installation”:Stars on this job 55%4.81★Number of such jobs 25%89Overall Experts Score 20%86Job match= 83Stars are pulled toward the category average (4.89★) when a company has few tagged jobs, so 3 perfect reviews don’t beat 80 great ones. 4.3★ scores 0, 5.0★ scores full. Volume is compared with the busiest company for this job.83
 Steg PlumbingHow Job match is calculatedBuilt only from reviews Google tagged “Faucet installation”:Stars on this job 55%5.00★Number of such jobs 25%9Overall Experts Score 20%93Job match= 82Stars are pulled toward the category average (4.89★) when a company has few tagged jobs, so 3 perfect reviews don’t beat 80 great ones. 4.3★ scores 0, 5.0★ scores full. Volume is compared with the busiest company for this job.82
 Mr. Plumber by Metzler & HallamHow Job match is calculatedBuilt only from reviews Google tagged “Faucet installation”:Stars on this job 55%4.88★Number of such jobs 25%16Overall Experts Score 20%87Job match= 79Stars are pulled toward the category average (4.89★) when a company has few tagged jobs, so 3 perfect reviews don’t beat 80 great ones. 4.3★ scores 0, 5.0★ scores full. Volume is compared with the busiest company for this job.79
Job match = this company’s ★ on reviews Google tagged “Faucet installation” (shrunk toward the category average when there are few), how many such jobs it has done, and its overall Experts Score.
What customers said about faucet installation
Carter's My PlumberTechnician was on time, polite and listened to our needs. He went above and beyond in fixing our hose spigot and gave helpful advice on a kitchen faucet concern. Always have been very pleased with Carter’s work.
Dutton Plumbing, Inc.Excellent service from everyone in this company. Very easy to talk with, very professional. They will be my choice for the future!
Steg PlumbingThe technician was very polite and did a fantastic job in replacing my bathroom faucet.
Carter's My PlumberJoshua was very professional and good to work with. He was very thorough and explained everything well. He was very attentive to his work. I would like to have him do our work again.
Carter's My PlumberExcellent service. Technician was efficient and explained clearly what was wrong with the drain and faucet. Everything is working perfectly now.
Carter's My PlumberWe have used Carter’s several times, inside and outside the house. They are quick to provide service, give fair estimates before doing work. And stuff works when they are done.
Overall ratings
Experts Score 0–100Experts Score (0–100)Absolute quality first: recency-weighted star average (≈54%), share of 1–2★ reviews (≈24%), customers’ price verdicts (≈14%), owner replies to critical reviews (≈7%); minus up to 10 points each for complaints flagged in Google review highlights and for a real slide in recent ratings. Hover a company’s score on its page for the full breakdown. and a letter grade per factor (A = top 20% of leak detection services).
| # | Company | ScoreExperts Score (0–100)Absolute quality first: recency-weighted star average (≈54%), share of 1–2★ reviews (≈24%), customers’ price verdicts (≈14%), owner replies to critical reviews (≈7%); minus up to 10 points each for complaints flagged in Google review highlights and for a real slide in recent ratings. Hover a company’s score on its page for the full breakdown. | FactorsFactor grades, in orderSatisfaction (54%): Recency-weighted star average (2-year half-life), shrunk toward the category mean by review volume; the company’s own lifetime average as the prior; absolute: 4.0★ = 0, 5★ = 100.Reliability (24%): How rarely jobs go badly: share of 1–2★ reviews — 60% the last 24 months (or the 20 newest if fewer), 40% all-time; 0% = 100, 15%+ = 0; the category percentile can only raise it.Craft & service (0%): Google review highlights: Quality, Professionalism, Responsiveness, Punctuality — how rarely reviewers flag them as a negative, per review since highlights began; 0% = 100, 5%+ = 0. Subtracted from the score (up to −10), never averaged in — clean highlights are the norm, not a bonus.Value (14%): Customers’ own price verdicts (Great / Reasonable vs Overpriced) and Value highlights; 65% absolute (all “reasonable” ≈ 80, “great” = 100), the category percentile can only raise it.Momentum (0%): Penalises only a real slide: last-12-month average below lifetime (−0.5★ = 0). Still 4.8★+ over the last year, or steady/improving = 100. Subtracted from the score (up to −10), never averaged in.Replies to reviews (7%): How often the owner publicly replies to reviews under 5★ (1–4★). Needs 3+ such reviews, otherwise not counted; 65% absolute (80%+ replied = 100), the category percentile can only raise it.One letter per factor score: A = 80+, B = 60–79, C = 40–59, D = 20–39, F = below 20. | ★Google star rating as shown on Google Maps. | Typical billMedian bill customers of this company reported in their reviews (needs 3+ priced reviews). |
|---|---|---|---|---|---|
| 1 |  Penn Plumbing LLCSpeedway, IN | A 100How the Experts Score is calculatedEach factor is scored 0–100 on absolute terms (standing in the category can only raise it), then weighted; problems flagged in review highlights or a recent slide in ratings are subtracted:Satisfaction 59%100+58.7Reliability 26%99+25.8Value 15%100+15.2Experts Score= 100Not enough data for replies to reviews; its weight is shared by the others.Grade A: A = 80+, B = 60–79, C = 40–59, D = 20–39. Needs 10+ reviews. | AA–AA– | 5.00 | $999 |
| 2 |  Prime Plumbing & Drains, LLCSpeedway, IN | A 97How the Experts Score is calculatedEach factor is scored 0–100 on absolute terms (standing in the category can only raise it), then weighted; problems flagged in review highlights or a recent slide in ratings are subtracted:Satisfaction 55%96+52.4Reliability 24%96+23.3Value 14%100+14.1Replies to reviews 7%100+7.1Experts Score= 97Grade A: A = 80+, B = 60–79, C = 40–59, D = 20–39. Needs 10+ reviews. | AA–AAA | 4.97 | $154 |
| 3 | Steg PlumbingSpeedway, IN | A 93How the Experts Score is calculatedEach factor is scored 0–100 on absolute terms (standing in the category can only raise it), then weighted; problems flagged in review highlights or a recent slide in ratings are subtracted:Satisfaction 55%94+51.3Reliability 24%91+22.1Value 14%95+13.4Replies to reviews 7%96+6.8Craft & service penalty94−0.6Experts Score= 93Grade A: A = 80+, B = 60–79, C = 40–59, D = 20–39. Needs 10+ reviews. | AAAAAA | 4.90 | $410 |
| 4 | Grey Plumbing Inc.Speedway, IN | A 92How the Experts Score is calculatedEach factor is scored 0–100 on absolute terms (standing in the category can only raise it), then weighted; problems flagged in review highlights or a recent slide in ratings are subtracted:Satisfaction 55%96+52.4Reliability 24%94+22.8Value 14%100+14.1Replies to reviews 7%46+3.3Craft & service penalty95−0.5Experts Score= 92Grade A: A = 80+, B = 60–79, C = 40–59, D = 20–39. Needs 10+ reviews. | AAAAAC | 4.96 | $383 |
| 5 | Carter's My PlumberSpeedway, IN | A 92How the Experts Score is calculatedEach factor is scored 0–100 on absolute terms (standing in the category can only raise it), then weighted; problems flagged in review highlights or a recent slide in ratings are subtracted:Satisfaction 55%93+50.7Reliability 24%96+23.3Value 14%79+11.2Replies to reviews 7%100+7.1Experts Score= 92Grade A: A = 80+, B = 60–79, C = 40–59, D = 20–39. Needs 10+ reviews. | AA–BAA | 4.93 | $447 |
| 6 | Mr. Plumber by Metzler & HallamSpeedway, IN | A 87How the Experts Score is calculatedEach factor is scored 0–100 on absolute terms (standing in the category can only raise it), then weighted; problems flagged in review highlights or a recent slide in ratings are subtracted:Satisfaction 55%87+47.5Reliability 24%84+20.4Value 14%88+12.4Replies to reviews 7%100+7.1Craft & service penalty96−0.4Experts Score= 87Grade A: A = 80+, B = 60–79, C = 40–59, D = 20–39. Needs 10+ reviews. | AAAAAA | 4.86 | $161 |
| 7 | Carter's My PlumberSpeedway, IN | A 86How the Experts Score is calculatedEach factor is scored 0–100 on absolute terms (standing in the category can only raise it), then weighted; problems flagged in review highlights or a recent slide in ratings are subtracted:Satisfaction 55%86+46.9Reliability 24%86+20.8Value 14%84+11.9Replies to reviews 7%100+7.1Craft & service penalty97−0.3Experts Score= 86Grade A: A = 80+, B = 60–79, C = 40–59, D = 20–39. Needs 10+ reviews. | AAAAAA | 4.88 | $529 |
| 8 | Dutton Plumbing, Inc.Speedway, IN | A 85How the Experts Score is calculatedEach factor is scored 0–100 on absolute terms (standing in the category can only raise it), then weighted; problems flagged in review highlights or a recent slide in ratings are subtracted:Satisfaction 55%88+48Reliability 24%82+19.9Value 14%91+12.9Replies to reviews 7%59+4.2Craft & service penalty97−0.3Experts Score= 85Grade A: A = 80+, B = 60–79, C = 40–59, D = 20–39. Needs 10+ reviews. | AAAAAC | 4.88 | $693 |
What jobs cost
What customers paid, from the price Google asks reviewers to report.
| Job | Low25th percentile: 1 in 4 customers paid less than this. | TypicalMedian of the bill customers reported in their Google review (Google asks reviewers for a price range; we use the middle of each range). | High75th percentile: 1 in 4 customers paid more than this. | FairOf customers who rated the price, the share who chose “Great price” or “Reasonable” rather than “Overpriced”. |
|---|---|---|---|---|
| Plumbing pipe repair | $322 | $548 | $1.1k | 97% |
| Toilet repair | $176 | $340 | $656 | 92% |
| Plumbing leak detection | $78 | $248 | $630 | 96% |
| Drain cleaning | $161 | $295 | $493 | 95% |
| Water heater installation | $1.2k | $1.9k | $2.5k | 96% |
| HVAC system maintenance | $27 | $104 | $216 | 99% |
| Faucet repair | $166 | $351 | $529 | 95% |
| Plumbing leak repair | $227 | $441 | $807 | 94% |
| A/C system maintenance | $37 | $124 | $278 | 98% |
| Faucet installation | $292 | $454 | $593 | 95% |
| Water heater repair | $78 | $251 | $466 | 97% |
| Outdoor plumbing system repair | $441 | $855 | $1.5k | 95% |
Leak Detection Services in Speedway, IN at a glance
How the 8 leak detection services we rated in Speedway, IN compare, and what customers praise most.
Experts Score grades
A = score 80+, F = below 20.
- Grade A8100%
- Grade B00%
- Grade C00%
- Grade D00%
- Grade F00%
Google ratings
Average stars per company.
- 4.90★ and up563%
- 4.80–4.89★338%
- 4.60–4.79★00%
- Below 4.60★00%
What customers praise
Share of Google review highlights.
- Quality8,68620%
- Professionalism10,49124%
- Responsiveness9,17921%
- Punctuality8,85520%
- Value6,05714%
Was the price fair?
All price verdicts left with reviews.
- Great price1,85626%
- Reasonable4,43261%
- Overpriced3295%
- Not sure5998%
Price verdicts by year
Share calling it great / reasonable / overpriced.
How we grade
Satisfaction (54%) — Recency-weighted star average (2-year half-life), shrunk toward the category mean by review volume; the company’s own lifetime average as the prior; absolute: 4.0★ = 0, 5★ = 100.
Reliability (24%) — How rarely jobs go badly: share of 1–2★ reviews — 60% the last 24 months (or the 20 newest if fewer), 40% all-time; 0% = 100, 15%+ = 0; the category percentile can only raise it.
Craft & service (penalty, up to −10) — Google review highlights: Quality, Professionalism, Responsiveness, Punctuality — how rarely reviewers flag them as a negative, per review since highlights began; 0% = 100, 5%+ = 0. Subtracted from the score (up to −10), never averaged in — clean highlights are the norm, not a bonus.
Value (14%) — Customers’ own price verdicts (Great / Reasonable vs Overpriced) and Value highlights; 65% absolute (all “reasonable” ≈ 80, “great” = 100), the category percentile can only raise it.
Momentum (penalty, up to −10) — Penalises only a real slide: last-12-month average below lifetime (−0.5★ = 0). Still 4.8★+ over the last year, or steady/improving = 100. Subtracted from the score (up to −10), never averaged in.
Replies to reviews (7%) — How often the owner publicly replies to reviews under 5★ (1–4★). Needs 3+ such reviews, otherwise not counted; 65% absolute (80%+ replied = 100), the category percentile can only raise it.