
The Best Oil Change Services in Philadelphia, PA
We graded 10 companies on seven things customers actually report: satisfaction, reliability, workmanship, value, momentum, track record and how owners handle complaints.
From 99,672 Google reviews of 160 top-rated oil change services nationwide; 10 of them in Philadelphia, PA. Updated November 13, 2026.
Find the right company for your job
Pick the job — we re-rank companies by how customers rated that exact job.
Best oil change services in Philadelphia for tires
Clear ✕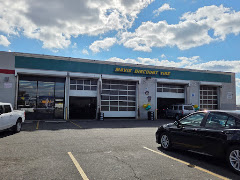 Mavis Discount TireHow Job match is calculatedBuilt only from reviews Google tagged “Tires”:Stars on this job 55%4.88★Number of such jobs 25%198Overall Experts Score 20%82Job match= 87Stars are pulled toward the category average (4.80★) when a company has few tagged jobs, so 3 perfect reviews don’t beat 80 great ones. 4.3★ scores 0, 5.0★ scores full. Volume is compared with the busiest company for this job.87
 Monte & Sons Auto Repair, Inc.How Job match is calculatedBuilt only from reviews Google tagged “Tires”:Stars on this job 55%5.00★Number of such jobs 25%28Overall Experts Score 20%86Job match= 85Stars are pulled toward the category average (4.80★) when a company has few tagged jobs, so 3 perfect reviews don’t beat 80 great ones. 4.3★ scores 0, 5.0★ scores full. Volume is compared with the busiest company for this job.85
 Meineke Car Care CenterHow Job match is calculatedBuilt only from reviews Google tagged “Tires”:Stars on this job 55%4.85★Number of such jobs 25%62Overall Experts Score 20%92Job match= 81Stars are pulled toward the category average (4.80★) when a company has few tagged jobs, so 3 perfect reviews don’t beat 80 great ones. 4.3★ scores 0, 5.0★ scores full. Volume is compared with the busiest company for this job.81
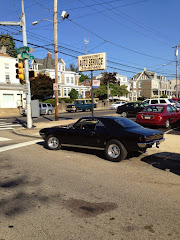 Fountain Street Auto ServiceHow Job match is calculatedBuilt only from reviews Google tagged “Tires”:Stars on this job 55%5.00★Number of such jobs 25%13Overall Experts Score 20%75Job match= 76Stars are pulled toward the category average (4.80★) when a company has few tagged jobs, so 3 perfect reviews don’t beat 80 great ones. 4.3★ scores 0, 5.0★ scores full. Volume is compared with the busiest company for this job.76
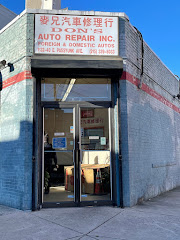 Don's Auto RepairHow Job match is calculatedBuilt only from reviews Google tagged “Tires”:Stars on this job 55%5.00★Number of such jobs 25%21Overall Experts Score 20%53Job match= 76Stars are pulled toward the category average (4.80★) when a company has few tagged jobs, so 3 perfect reviews don’t beat 80 great ones. 4.3★ scores 0, 5.0★ scores full. Volume is compared with the busiest company for this job.76
 Take 5 Oil ChangeHow Job match is calculatedBuilt only from reviews Google tagged “Tires”:Stars on this job 55%5.00★Number of such jobs 25%12Overall Experts Score 20%69Job match= 75Stars are pulled toward the category average (4.80★) when a company has few tagged jobs, so 3 perfect reviews don’t beat 80 great ones. 4.3★ scores 0, 5.0★ scores full. Volume is compared with the busiest company for this job.75
 Kens AutomotiveHow Job match is calculatedBuilt only from reviews Google tagged “Tires”:Stars on this job 55%4.77★Number of such jobs 25%47Overall Experts Score 20%75Job match= 70Stars are pulled toward the category average (4.80★) when a company has few tagged jobs, so 3 perfect reviews don’t beat 80 great ones. 4.3★ scores 0, 5.0★ scores full. Volume is compared with the busiest company for this job.70
 Salhani Auto Service & Sales Emissions & State Inspection StationHow Job match is calculatedBuilt only from reviews Google tagged “Tires”:Stars on this job 55%4.76★Number of such jobs 25%17Overall Experts Score 20%86Job match= 68Stars are pulled toward the category average (4.80★) when a company has few tagged jobs, so 3 perfect reviews don’t beat 80 great ones. 4.3★ scores 0, 5.0★ scores full. Volume is compared with the busiest company for this job.68
Job match = this company’s ★ on reviews Google tagged “Tires” (shrunk toward the category average when there are few), how many such jobs it has done, and its overall Experts Score.
What customers said about tires
Meineke Car Care CenterThis Meineke shop has helped me so much! Numerous times when I have been stuck in a pickle and needed work done on my car, they have always been there for me; ready to take my car at the drop of a hat. This week I had an unexpected flat tire and worried about it getting fixed quick and affordably. I had expressed to…
Monte & Sons Auto Repair, Inc.It’s so hard to say goodbye to the best mechanics I have ever met. I was introduced to them by my friend Lonnie. The dealer said I needed a new engine which was going to cost $6,000. Lonnie came and picked up my car to take it to their shop. They ran diagnostics on the car said the engine was fine and was hooked.…
Mavis Discount TireThe courtesy and professionalism is outstanding. On the day that I went in for a tire repair, the team was short staffed due to unexpected call outs. The manager, James, was sincerely apologetic and even went to help the other workers get various jobs down. Also, my thanks to Jaylin and Tuan for their hard work, patience, and kindness.
Don's Auto RepairI recently took my car to Don's Auto Repair for a vehicle inspection, and I couldn't be happier with the experience. The service was thorough and efficient, and the team made sure I understood every step of the process. The price was great, and I felt like I got excellent value for my money. The wait time was also…
Fountain Street Auto ServiceBeen here twice. Both times they were very willing fit me in. In both cases the wait was reasonable and so was the price. Definitely the first place I’ll go next time!
Kens AutomotiveGot my truck towed over for not starting. Issue was quickly resolved. Communication was great and all costs were clearly presented with no surprises. This is the only place I will be taking my truck for service from now on! 10/10
Overall ratings
Experts Score 0–100Experts Score (0–100)Absolute quality first: recency-weighted star average (≈54%), share of 1–2★ reviews (≈24%), customers’ price verdicts (≈14%), owner replies to critical reviews (≈7%); minus up to 10 points each for complaints flagged in Google review highlights and for a real slide in recent ratings. Hover a company’s score on its page for the full breakdown. and a letter grade per factor (A = top 20% of oil change services).
| # | Company | ScoreExperts Score (0–100)Absolute quality first: recency-weighted star average (≈54%), share of 1–2★ reviews (≈24%), customers’ price verdicts (≈14%), owner replies to critical reviews (≈7%); minus up to 10 points each for complaints flagged in Google review highlights and for a real slide in recent ratings. Hover a company’s score on its page for the full breakdown. | FactorsFactor grades, in orderSatisfaction (54%): Recency-weighted star average (2-year half-life), shrunk toward the category mean by review volume; the company’s own lifetime average as the prior; absolute: 4.0★ = 0, 5★ = 100.Reliability (24%): How rarely jobs go badly: share of 1–2★ reviews — 60% the last 24 months (or the 20 newest if fewer), 40% all-time; 0% = 100, 15%+ = 0; the category percentile can only raise it.Craft & service (0%): Google review highlights: Quality, Professionalism, Responsiveness, Punctuality — how rarely reviewers flag them as a negative, per review since highlights began; 0% = 100, 5%+ = 0. Subtracted from the score (up to −10), never averaged in — clean highlights are the norm, not a bonus.Value (14%): Customers’ own price verdicts (Great / Reasonable vs Overpriced) and Value highlights; 65% absolute (all “reasonable” ≈ 80, “great” = 100), the category percentile can only raise it.Momentum (0%): Penalises only a real slide: last-12-month average below lifetime (−0.5★ = 0). Still 4.8★+ over the last year, or steady/improving = 100. Subtracted from the score (up to −10), never averaged in.Replies to reviews (7%): How often the owner publicly replies to reviews under 5★ (1–4★). Needs 3+ such reviews, otherwise not counted; 65% absolute (80%+ replied = 100), the category percentile can only raise it.One letter per factor score: A = 80+, B = 60–79, C = 40–59, D = 20–39, F = below 20. | ★Google star rating as shown on Google Maps. | Typical billMedian bill customers of this company reported in their reviews (needs 3+ priced reviews). |
|---|---|---|---|---|---|
| 1 | Meineke Car Care CenterPhiladelphia, PA | A 92How the Experts Score is calculatedEach factor is scored 0–100 on absolute terms (standing in the category can only raise it), then weighted; problems flagged in review highlights or a recent slide in ratings are subtracted:Satisfaction 55%95+51.8Reliability 24%95+23Value 14%100+14.1Replies to reviews 7%52+3.7Craft & service penalty92−0.8Experts Score= 92Grade A: A = 80+, B = 60–79, C = 40–59, D = 20–39. Needs 10+ reviews. | AAAAAC | 4.90 | — |
| 2 | Salhani Auto Service & Sales Emissions & State Inspection StationPhiladelphia, PA | A 86How the Experts Score is calculatedEach factor is scored 0–100 on absolute terms (standing in the category can only raise it), then weighted; problems flagged in review highlights or a recent slide in ratings are subtracted:Satisfaction 55%87+47.5Reliability 24%78+18.9Value 14%100+14.1Replies to reviews 7%83+5.9Craft & service penalty97−0.3Experts Score= 86Grade A: A = 80+, B = 60–79, C = 40–59, D = 20–39. Needs 10+ reviews. | ABAAAA | 4.84 | — |
| 3 | Monte & Sons Auto Repair, Inc.Philadelphia, PA | A 86How the Experts Score is calculatedEach factor is scored 0–100 on absolute terms (standing in the category can only raise it), then weighted; problems flagged in review highlights or a recent slide in ratings are subtracted:Satisfaction 55%87+47.5Reliability 24%78+18.9Value 14%100+14.1Replies to reviews 7%84+5.9Experts Score= 86Grade A: A = 80+, B = 60–79, C = 40–59, D = 20–39. Needs 10+ reviews. | ABAAAA | 4.81 | — |
| 4 | Mavis Discount TirePhiladelphia, PA | A 82How the Experts Score is calculatedEach factor is scored 0–100 on absolute terms (standing in the category can only raise it), then weighted; problems flagged in review highlights or a recent slide in ratings are subtracted:Satisfaction 55%83+45.3Reliability 24%74+17.9Value 14%100+14.1Replies to reviews 7%67+4.7Experts Score= 82Grade A: A = 80+, B = 60–79, C = 40–59, D = 20–39. Needs 10+ reviews. | AB–AAB | 4.72 | — |
| 5 | Kens AutomotivePhiladelphia, PA | B 75How the Experts Score is calculatedEach factor is scored 0–100 on absolute terms (standing in the category can only raise it), then weighted; problems flagged in review highlights or a recent slide in ratings are subtracted:Satisfaction 55%78+42.5Reliability 24%70+17Value 14%90+12.7Replies to reviews 7%63+4.5Craft & service penalty95−0.5Momentum penalty91−0.9Experts Score= 75Grade B: A = 80+, B = 60–79, C = 40–59, D = 20–39. Needs 10+ reviews. | BBAAAB | 4.77 | — |
| 6 | Fountain Street Auto ServicePhiladelphia, PA | B 75How the Experts Score is calculatedEach factor is scored 0–100 on absolute terms (standing in the category can only raise it), then weighted; problems flagged in review highlights or a recent slide in ratings are subtracted:Satisfaction 55%74+40.4Reliability 24%72+17.5Value 14%100+14.1Replies to reviews 7%100+7.1Momentum penalty63−3.7Experts Score= 75Grade B: A = 80+, B = 60–79, C = 40–59, D = 20–39. Needs 10+ reviews. | BBAABA | 4.80 | — |
| 7 |  Valvoline Instant Oil ChangePhiladelphia, PA | B 70How the Experts Score is calculatedEach factor is scored 0–100 on absolute terms (standing in the category can only raise it), then weighted; problems flagged in review highlights or a recent slide in ratings are subtracted:Satisfaction 55%69+37.6Reliability 24%57+13.8Value 14%95+13.4Replies to reviews 7%76+5.4Experts Score= 70Grade B: A = 80+, B = 60–79, C = 40–59, D = 20–39. Needs 10+ reviews. | BC–AAB | 4.66 | — |
| 8 | Take 5 Oil ChangePhiladelphia, PA | B 69How the Experts Score is calculatedEach factor is scored 0–100 on absolute terms (standing in the category can only raise it), then weighted; problems flagged in review highlights or a recent slide in ratings are subtracted:Satisfaction 55%73+39.8Reliability 24%68+16.5Value 14%54+7.6Replies to reviews 7%100+7.1Momentum penalty78−2.2Experts Score= 69Grade B: A = 80+, B = 60–79, C = 40–59, D = 20–39. Needs 10+ reviews. | BB–CBA | 4.76 | — |
| 9 |  Tire Heaven USA ?? 24 hour Emergency Service we come to you !Philadelphia, PA | C 59How the Experts Score is calculatedEach factor is scored 0–100 on absolute terms (standing in the category can only raise it), then weighted; problems flagged in review highlights or a recent slide in ratings are subtracted:Satisfaction 55%64+34.9Reliability 24%37+9Value 14%60+8.5Replies to reviews 7%100+7.1Momentum penalty93−0.7Experts Score= 59Grade C: A = 80+, B = 60–79, C = 40–59, D = 20–39. Needs 10+ reviews. | BD–BAA | 4.67 | — |
| 10 | Don's Auto RepairPhiladelphia, PA | C 53How the Experts Score is calculatedEach factor is scored 0–100 on absolute terms (standing in the category can only raise it), then weighted; problems flagged in review highlights or a recent slide in ratings are subtracted:Satisfaction 55%64+34.9Reliability 24%46+11.2Value 14%100+14.1Replies to reviews 7%4+0.3Craft & service penalty90−1Momentum penalty32−6.8Experts Score= 53Grade C: A = 80+, B = 60–79, C = 40–59, D = 20–39. Needs 10+ reviews. | BCAADF | 4.72 | — |
What jobs cost
What customers paid, from the price Google asks reviewers to report.
| Job | Low25th percentile: 1 in 4 customers paid less than this. | TypicalMedian of the bill customers reported in their Google review (Google asks reviewers for a price range; we use the middle of each range). | High75th percentile: 1 in 4 customers paid more than this. | FairOf customers who rated the price, the share who chose “Great price” or “Reasonable” rather than “Overpriced”. |
|---|
Oil Change Services in Philadelphia, PA at a glance
How the 10 oil change services we rated in Philadelphia, PA compare, and what customers praise most.
Experts Score grades
A = score 80+, F = below 20.
- Grade A440%
- Grade B440%
- Grade C220%
- Grade D00%
- Grade F00%
Google ratings
Average stars per company.
- 4.90★ and up110%
- 4.80–4.89★330%
- 4.60–4.79★660%
- Below 4.60★00%
What customers praise
Share of Google review highlights.
- Quality4,27627%
- Professionalism4,84330%
- Responsiveness00%
- Punctuality3,42721%
- Value3,54122%
Was the price fair?
All price verdicts left with reviews.
- Great price6,87142%
- Reasonable8,36751%
- Overpriced5814%
- Not sure5303%
Price verdicts by year
Share calling it great / reasonable / overpriced.
How we grade
Satisfaction (54%) — Recency-weighted star average (2-year half-life), shrunk toward the category mean by review volume; the company’s own lifetime average as the prior; absolute: 4.0★ = 0, 5★ = 100.
Reliability (24%) — How rarely jobs go badly: share of 1–2★ reviews — 60% the last 24 months (or the 20 newest if fewer), 40% all-time; 0% = 100, 15%+ = 0; the category percentile can only raise it.
Craft & service (penalty, up to −10) — Google review highlights: Quality, Professionalism, Responsiveness, Punctuality — how rarely reviewers flag them as a negative, per review since highlights began; 0% = 100, 5%+ = 0. Subtracted from the score (up to −10), never averaged in — clean highlights are the norm, not a bonus.
Value (14%) — Customers’ own price verdicts (Great / Reasonable vs Overpriced) and Value highlights; 65% absolute (all “reasonable” ≈ 80, “great” = 100), the category percentile can only raise it.
Momentum (penalty, up to −10) — Penalises only a real slide: last-12-month average below lifetime (−0.5★ = 0). Still 4.8★+ over the last year, or steady/improving = 100. Subtracted from the score (up to −10), never averaged in.
Replies to reviews (7%) — How often the owner publicly replies to reviews under 5★ (1–4★). Needs 3+ such reviews, otherwise not counted; 65% absolute (80%+ replied = 100), the category percentile can only raise it.