
The Best Personal Trainers
We graded 18 companies on seven things customers actually report: satisfaction, reliability, workmanship, value, momentum, track record and how owners handle complaints.
From 3,889 Google reviews of 18 top-rated personal trainers nationwide. Updated October 25, 2026.
Find the right company for your job
Pick the job — we re-rank companies by how customers rated that exact job.
Best personal trainers for group lessons
Clear ✕Not enough reviews tagged “Group lessons” to rank companies yet.
Job match = this company’s ★ on reviews Google tagged “Group lessons” (shrunk toward the category average when there are few), how many such jobs it has done, and its overall Experts Score.
What customers said about group lessons
 The Studio Wellness Community
My first experience with yoga! I was able to trust and relax!! Very cleansing experience!
The Studio Wellness CommunityLoved our experience and have already recommended to my friends and family. Keri was so kind and really went out of her way to make this work for us♥️♥️♥️
Overall ratings
Experts Score 0–100Experts Score (0–100)Weighted average of 7 percentiles vs other companies in the category: satisfaction 35%, workmanship 20%, reliability 15%, value 10%, momentum 8%, track record 7%, owner replies 5%. Hover a company’s score on its page for the full breakdown. and a letter grade per factor (A = top 20% of personal trainers).
| # | Company | ScoreExperts Score (0–100)Weighted average of 7 percentiles vs other companies in the category: satisfaction 35%, workmanship 20%, reliability 15%, value 10%, momentum 8%, track record 7%, owner replies 5%. Hover a company’s score on its page for the full breakdown. | FactorsFactor grades, in orderSatisfaction (35%): Recency-weighted star average (2-year half-life), shrunk toward the category mean by review volume.Reliability (15%): How rarely jobs go badly: share of 1–2★ reviews in the last 24 months (fewer = better).Craft & service (20%): Google review highlights: Quality, Professionalism, Responsiveness, Punctuality — net praise per review.Value (10%): Customers’ own price verdicts (Great / Reasonable vs Overpriced) and Value highlights.Momentum (8%): Last 12 months vs lifetime average — improving or slipping.Track record (7%): Review volume and years with reviews.Accountability (5%): Owner replies to 1–3★ reviews.One letter per factor, by percentile among peers: A = top 20%, B = next 20%, and so on. | ★Google star rating as shown on Google Maps. | Typical billMedian bill customers of this company reported in their reviews (needs 3+ priced reviews). |
|---|---|---|---|---|---|
| 1 |  Club Pilates Port St LuciePort St. Lucie, FL | A 82How the Experts Score is calculatedEach factor is a percentile (0–100) against the other companies in this category, then weighted:Satisfaction 50%86+43Reliability 21%97+20.8Momentum 11%62+7.1Track record 10%53+5.3Accountability 7%75+5.4Experts Score= 82Not enough data for craft & service, value; its weight is shared by the others.Grade A: A = 80+, B = 60–79, C = 40–59, D = 20–39. Needs 10+ reviews. | AA––BCB | 4.96 | — |
| 2 | 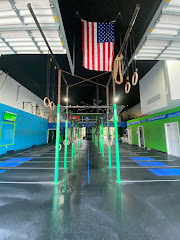 HEW FitnessPort St. Lucie, FL | A 80How the Experts Score is calculatedEach factor is a percentile (0–100) against the other companies in this category, then weighted:Satisfaction 50%92+46Reliability 21%53+11.4Momentum 11%68+7.8Track record 10%86+8.6Accountability 7%86+6.1Experts Score= 80Not enough data for craft & service, value; its weight is shared by the others.Grade A: A = 80+, B = 60–79, C = 40–59, D = 20–39. Needs 10+ reviews. | AC––BAA | 4.99 | — |
| 3 |  The X House Performance CenterPort St. Lucie, FL | B 77How the Experts Score is calculatedEach factor is a percentile (0–100) against the other companies in this category, then weighted:Satisfaction 39%97+37.7Reliability 17%92+15.3Craft & service 22%28+6.2Momentum 9%79+7Track record 8%92+7.2Accountability 6%69+3.8Experts Score= 77Not enough data for value; its weight is shared by the others.Grade B: A = 80+, B = 60–79, C = 40–59, D = 20–39. Needs 10+ reviews. | AAD–BAB | 4.97 | — |
| 4 |  30 Plus Fit Club LLCPort St. Lucie, FL | B 69How the Experts Score is calculatedEach factor is a percentile (0–100) against the other companies in this category, then weighted:Satisfaction 39%81+31.5Reliability 17%69+11.5Craft & service 22%83+18.4Momentum 9%29+2.6Track record 8%36+2.8Accountability 6%42+2.3Experts Score= 69Not enough data for value; its weight is shared by the others.Grade B: A = 80+, B = 60–79, C = 40–59, D = 20–39. Needs 10+ reviews. | ABA–DDC | 5.00 | — |
| 5 |  The Sweat Co.Mandan, ND | B 67How the Experts Score is calculatedEach factor is a percentile (0–100) against the other companies in this category, then weighted:Satisfaction 39%75+29.2Reliability 17%75+12.5Craft & service 22%72+16Momentum 9%38+3.4Track record 8%42+3.3Accountability 6%42+2.3Experts Score= 67Not enough data for value; its weight is shared by the others.Grade B: A = 80+, B = 60–79, C = 40–59, D = 20–39. Needs 10+ reviews. | BBB–DCC | 4.99 | — |
| 6 |  CrossFit TraditionPort St. Lucie, FL | B 63How the Experts Score is calculatedEach factor is a percentile (0–100) against the other companies in this category, then weighted:Satisfaction 39%69+26.8Reliability 17%81+13.5Craft & service 22%39+8.7Momentum 9%74+6.6Track record 8%69+5.4Accountability 6%42+2.3Experts Score= 63Not enough data for value; its weight is shared by the others.Grade B: A = 80+, B = 60–79, C = 40–59, D = 20–39. Needs 10+ reviews. | BAD–BBC | 4.98 | — |
| 7 |  Therapy RetreatMandan, ND | C 57How the Experts Score is calculatedEach factor is a percentile (0–100) against the other companies in this category, then weighted:Satisfaction 50%64+32Reliability 21%86+18.4Momentum 11%29+3.3Track record 10%3+0.3Accountability 7%42+3Experts Score= 57Not enough data for craft & service, value; its weight is shared by the others.Grade C: A = 80+, B = 60–79, C = 40–59, D = 20–39. Needs 10+ reviews. | BA––DFC | 5.00 | — |
| 8 |  UNLMTD PERFORMANCEPort St. Lucie, FL | C 53How the Experts Score is calculatedEach factor is a percentile (0–100) against the other companies in this category, then weighted:Satisfaction 50%58+29Reliability 21%64+13.7Momentum 11%56+6.4Track record 10%8+0.8Accountability 7%42+3Experts Score= 53Not enough data for craft & service, value; its weight is shared by the others.Grade C: A = 80+, B = 60–79, C = 40–59, D = 20–39. Needs 10+ reviews. | CB––CFC | 4.98 | — |
| 9 |  EliteX Personal TrainingPort St. Lucie, FL | C 50How the Experts Score is calculatedEach factor is a percentile (0–100) against the other companies in this category, then weighted:Satisfaction 43%36+15.4Reliability 18%42+7.7Craft & service 24%94+22.9Track record 9%14+1.2Accountability 6%42+2.6Experts Score= 50Not enough data for value, momentum; its weight is shared by the others.Grade C: A = 80+, B = 60–79, C = 40–59, D = 20–39. Needs 10+ reviews. | DCA––FC | 5.00 | — |
| 10 | The Studio Wellness CommunityMandan, ND | C 50How the Experts Score is calculatedEach factor is a percentile (0–100) against the other companies in this category, then weighted:Satisfaction 39%47+18.3Reliability 17%58+9.7Craft & service 22%61+13.6Momentum 9%44+3.9Track record 8%31+2.4Accountability 6%42+2.3Experts Score= 50Not enough data for value; its weight is shared by the others.Grade C: A = 80+, B = 60–79, C = 40–59, D = 20–39. Needs 10+ reviews. | CCB–CDC | 4.98 | — |
| 11 |  FLX33 "More Than a Gym"Port St. Lucie, FL | C 45How the Experts Score is calculatedEach factor is a percentile (0–100) against the other companies in this category, then weighted:Satisfaction 39%53+20.6Reliability 17%19+3.2Craft & service 22%50+11.1Momentum 9%50+4.4Track record 8%58+4.5Accountability 6%17+0.9Experts Score= 45Not enough data for value; its weight is shared by the others.Grade C: A = 80+, B = 60–79, C = 40–59, D = 20–39. Needs 10+ reviews. | CFC–CCF | 4.96 | — |
| 12 | 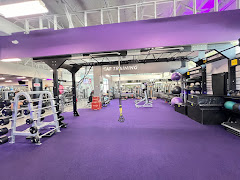 Anytime FitnessPort St. Lucie, FL | C 41How the Experts Score is calculatedEach factor is a percentile (0–100) against the other companies in this category, then weighted:Satisfaction 39%31+12.1Reliability 17%31+5.2Craft & service 22%17+3.8Momentum 9%97+8.6Track record 8%97+7.5Accountability 6%64+3.6Experts Score= 41Not enough data for value; its weight is shared by the others.Grade C: A = 80+, B = 60–79, C = 40–59, D = 20–39. Needs 10+ reviews. | DDF–AAB | 4.81 | — |
What jobs cost
What customers paid, from the price Google asks reviewers to report.
| Job | Low25th percentile: 1 in 4 customers paid less than this. | TypicalMedian of the bill customers reported in their Google review (Google asks reviewers for a price range; we use the middle of each range). | High75th percentile: 1 in 4 customers paid more than this. | FairOf customers who rated the price, the share who chose “Great price” or “Reasonable” rather than “Overpriced”. |
|---|
Was the price fair?
All price verdicts left with reviews.
Price verdicts by year
Share calling it great / reasonable / overpriced.
How we grade
Satisfaction (35%) — Recency-weighted star average (2-year half-life), shrunk toward the category mean by review volume.
Reliability (15%) — How rarely jobs go badly: share of 1–2★ reviews in the last 24 months (fewer = better).
Craft & service (20%) — Google review highlights: Quality, Professionalism, Responsiveness, Punctuality — net praise per review.
Value (10%) — Customers’ own price verdicts (Great / Reasonable vs Overpriced) and Value highlights.
Momentum (8%) — Last 12 months vs lifetime average — improving or slipping.
Track record (7%) — Review volume and years with reviews.
Accountability (5%) — Owner replies to 1–3★ reviews.