
The Best Pet Photography in Texas
We graded 10 companies on seven things customers actually report: satisfaction, reliability, workmanship, value, momentum, track record and how owners handle complaints.
From 33,339 Google reviews of 233 top-rated pet photography nationwide; 10 of them in Texas. Updated November 11, 2026.
Find the right company for your job
Pick the job — we re-rank companies by how customers rated that exact job.
Best pet photography in Texas for fashion photography
Clear ✕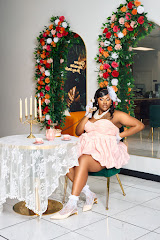 ELNJ PhotographyHow Job match is calculatedBuilt only from reviews Google tagged “Fashion photography”:Stars on this job 55%5.00★Number of such jobs 25%15Overall Experts Score 20%99Job match= 99Stars are pulled toward the category average (4.96★) when a company has few tagged jobs, so 3 perfect reviews don’t beat 80 great ones. 4.3★ scores 0, 5.0★ scores full. Volume is compared with the busiest company for this job.99
Job match = this company’s ★ on reviews Google tagged “Fashion photography” (shrunk toward the category average when there are few), how many such jobs it has done, and its overall Experts Score.
What customers said about fashion photography
ELNJ PhotographyVery professional made me feel very comfortable overall good vibes and experience
ELNJ PhotographyExtremely satisfied with our pictures! Very good communication & customer service.. it was storming and our shoot was scheduled to be outside, he came up with multiple backup plans… even brought a umbrella out and walked my daughter in the building the rain.
ELNJ PhotographyMan I had a great experience getting my grad pics done. You made me feel comfortable from the jump, which I needed fr. Everything felt natural, not forced, and you really brought the vision to life. The pics came out crazy!!! better than I even expected. Definitely locked in with you for future shoots, I appreciate you!
ELNJ PhotographyAlways a 5 out of 5! I love working with Lydell. He is very professional and it not only shows in his work but working with him in the studio as well. He always delivers top tier service. You would be missing out on greatness if you don’t book with him. He is the SETX GOAT!
 ELNJ Photography
Photography and customer service was EXCELLENT! Me and my daughter enjoyed the whole photo shoot experience and can't wait for our next shoot! 🙌🏾
ELNJ PhotographyI have done several photoshoots with this company & they were all great. I will definitely continue to return. Lydell makes you feel comfortable also is great from the editing to the quality it’s all perfect.



Overall ratings
Experts Score 0–100Experts Score (0–100)Absolute quality first: recency-weighted star average (≈54%), share of 1–2★ reviews (≈24%), customers’ price verdicts (≈14%), owner replies to critical reviews (≈7%); minus up to 10 points each for complaints flagged in Google review highlights and for a real slide in recent ratings. Hover a company’s score on its page for the full breakdown. and a letter grade per factor (A = top 20% of pet photography).
| # | Company | ScoreExperts Score (0–100)Absolute quality first: recency-weighted star average (≈54%), share of 1–2★ reviews (≈24%), customers’ price verdicts (≈14%), owner replies to critical reviews (≈7%); minus up to 10 points each for complaints flagged in Google review highlights and for a real slide in recent ratings. Hover a company’s score on its page for the full breakdown. | FactorsFactor grades, in orderSatisfaction (54%): Recency-weighted star average (2-year half-life), shrunk toward the category mean by review volume; the company’s own lifetime average as the prior; absolute: 4.0★ = 0, 5★ = 100.Reliability (24%): How rarely jobs go badly: share of 1–2★ reviews — 60% the last 24 months (or the 20 newest if fewer), 40% all-time; 0% = 100, 15%+ = 0; the category percentile can only raise it.Craft & service (0%): Google review highlights: Quality, Professionalism, Responsiveness, Punctuality — how rarely reviewers flag them as a negative, per review since highlights began; 0% = 100, 5%+ = 0. Subtracted from the score (up to −10), never averaged in — clean highlights are the norm, not a bonus.Value (14%): Customers’ own price verdicts (Great / Reasonable vs Overpriced) and Value highlights; 65% absolute (all “reasonable” ≈ 80, “great” = 100), the category percentile can only raise it.Momentum (0%): Penalises only a real slide: last-12-month average below lifetime (−0.5★ = 0). Still 4.8★+ over the last year, or steady/improving = 100. Subtracted from the score (up to −10), never averaged in.Replies to reviews (7%): How often the owner publicly replies to reviews under 5★ (1–4★). Needs 3+ such reviews, otherwise not counted; 65% absolute (80%+ replied = 100), the category percentile can only raise it.One letter per factor score: A = 80+, B = 60–79, C = 40–59, D = 20–39, F = below 20. | ★Google star rating as shown on Google Maps. | Typical billMedian bill customers of this company reported in their reviews (needs 3+ priced reviews). |
|---|---|---|---|---|---|
| 1 |  Penny Whistle PhotographyHackberry, TX | A 100How the Experts Score is calculatedEach factor is scored 0–100 on absolute terms (standing in the category can only raise it), then weighted; problems flagged in review highlights or a recent slide in ratings are subtracted:Satisfaction 59%100+58.7Reliability 26%99+25.8Value 15%100+15.2Experts Score= 100Not enough data for replies to reviews; its weight is shared by the others.Grade A: A = 80+, B = 60–79, C = 40–59, D = 20–39. Needs 10+ reviews. | AAAAA– | 4.99 | — |
| 2 | ELNJ PhotographyPort Neches, TX | A 99How the Experts Score is calculatedEach factor is scored 0–100 on absolute terms (standing in the category can only raise it), then weighted; problems flagged in review highlights or a recent slide in ratings are subtracted:Satisfaction 59%99+58.1Reliability 26%99+25.8Value 15%100+15.2Experts Score= 99Not enough data for replies to reviews; its weight is shared by the others.Grade A: A = 80+, B = 60–79, C = 40–59, D = 20–39. Needs 10+ reviews. | AA–AA– | 4.99 | — |
| 3 |  Laura Oglesbee Photography LLCPort Neches, TX | A 99How the Experts Score is calculatedEach factor is scored 0–100 on absolute terms (standing in the category can only raise it), then weighted; problems flagged in review highlights or a recent slide in ratings are subtracted:Satisfaction 69%99+68.5Reliability 31%98+30.2Experts Score= 99Not enough data for value, replies to reviews; its weight is shared by the others.Grade A: A = 80+, B = 60–79, C = 40–59, D = 20–39. Needs 10+ reviews. | AA––A– | 5.00 | — |
| 4 |  Innovative Images PhotographyHackberry, TX | A 98How the Experts Score is calculatedEach factor is scored 0–100 on absolute terms (standing in the category can only raise it), then weighted; problems flagged in review highlights or a recent slide in ratings are subtracted:Satisfaction 69%98+67.8Reliability 31%99+30.5Experts Score= 98Not enough data for value, replies to reviews; its weight is shared by the others.Grade A: A = 80+, B = 60–79, C = 40–59, D = 20–39. Needs 10+ reviews. | AA––A– | 4.98 | — |
| 5 |  Ivy Lane PortraitsPort Neches, TX | A 97How the Experts Score is calculatedEach factor is scored 0–100 on absolute terms (standing in the category can only raise it), then weighted; problems flagged in review highlights or a recent slide in ratings are subtracted:Satisfaction 59%98+57.5Reliability 26%97+25.3Value 15%93+14.2Experts Score= 97Not enough data for replies to reviews; its weight is shared by the others.Grade A: A = 80+, B = 60–79, C = 40–59, D = 20–39. Needs 10+ reviews. | AAAAA– | 4.96 | — |
| 6 |  Photography by MistyHackberry, TX | A 96How the Experts Score is calculatedEach factor is scored 0–100 on absolute terms (standing in the category can only raise it), then weighted; problems flagged in review highlights or a recent slide in ratings are subtracted:Satisfaction 55%94+51.3Reliability 24%96+23.3Value 14%100+14.1Replies to reviews 7%99+7Experts Score= 96Grade A: A = 80+, B = 60–79, C = 40–59, D = 20–39. Needs 10+ reviews. | AAAAAA | 4.93 | — |
| 7 |  Haute Dog Pet PhotographyHackberry, TX | A 93How the Experts Score is calculatedEach factor is scored 0–100 on absolute terms (standing in the category can only raise it), then weighted; problems flagged in review highlights or a recent slide in ratings are subtracted:Satisfaction 69%95+65.8Reliability 31%88+27.1Experts Score= 93Not enough data for value, replies to reviews; its weight is shared by the others.Grade A: A = 80+, B = 60–79, C = 40–59, D = 20–39. Needs 10+ reviews. | AAA–A– | 4.98 | — |
| 8 |  Bree Elle PhotographyPort Neches, TX | A 91How the Experts Score is calculatedEach factor is scored 0–100 on absolute terms (standing in the category can only raise it), then weighted; problems flagged in review highlights or a recent slide in ratings are subtracted:Satisfaction 59%91+53.4Reliability 26%85+22.2Value 15%100+15.2Experts Score= 91Not enough data for replies to reviews; its weight is shared by the others.Grade A: A = 80+, B = 60–79, C = 40–59, D = 20–39. Needs 10+ reviews. | AA–AA– | 4.91 | — |
| 9 |  Platinum Portrait ArtistsHackberry, TX | A 85How the Experts Score is calculatedEach factor is scored 0–100 on absolute terms (standing in the category can only raise it), then weighted; problems flagged in review highlights or a recent slide in ratings are subtracted:Satisfaction 55%86+46.9Reliability 24%79+19.2Value 14%89+12.6Replies to reviews 7%91+6.4Experts Score= 85Grade A: A = 80+, B = 60–79, C = 40–59, D = 20–39. Needs 10+ reviews. | ABAAAA | 4.84 | — |
| 10 |  Jenna Regan PhotographyHackberry, TX | B 69How the Experts Score is calculatedEach factor is scored 0–100 on absolute terms (standing in the category can only raise it), then weighted; problems flagged in review highlights or a recent slide in ratings are subtracted:Satisfaction 59%80+47Reliability 26%66+17.2Value 15%100+15.2Momentum penalty0−10Experts Score= 69Not enough data for replies to reviews; its weight is shared by the others.Grade B: A = 80+, B = 60–79, C = 40–59, D = 20–39. Needs 10+ reviews. | ABAAF– | 4.91 | — |
What jobs cost
What customers paid, from the price Google asks reviewers to report.
| Job | Low25th percentile: 1 in 4 customers paid less than this. | TypicalMedian of the bill customers reported in their Google review (Google asks reviewers for a price range; we use the middle of each range). | High75th percentile: 1 in 4 customers paid more than this. | FairOf customers who rated the price, the share who chose “Great price” or “Reasonable” rather than “Overpriced”. |
|---|
Pet Photography in Texas at a glance
How the 10 pet photography we rated in Texas compare, and what customers praise most.
Experts Score grades
A = score 80+, F = below 20.
- Grade A990%
- Grade B110%
- Grade C00%
- Grade D00%
- Grade F00%
Google ratings
Average stars per company.
- 4.90★ and up990%
- 4.80–4.89★110%
- 4.60–4.79★00%
- Below 4.60★00%
What customers praise
Share of Google review highlights.
- Quality2,61227%
- Professionalism2,72128%
- Responsiveness2,21823%
- Punctuality260%
- Value2,07521%
Was the price fair?
All price verdicts left with reviews.
- Great price1,68958%
- Reasonable1,08137%
- Overpriced532%
- Not sure803%
Price verdicts by year
Share calling it great / reasonable / overpriced.
How we grade
Satisfaction (54%) — Recency-weighted star average (2-year half-life), shrunk toward the category mean by review volume; the company’s own lifetime average as the prior; absolute: 4.0★ = 0, 5★ = 100.
Reliability (24%) — How rarely jobs go badly: share of 1–2★ reviews — 60% the last 24 months (or the 20 newest if fewer), 40% all-time; 0% = 100, 15%+ = 0; the category percentile can only raise it.
Craft & service (penalty, up to −10) — Google review highlights: Quality, Professionalism, Responsiveness, Punctuality — how rarely reviewers flag them as a negative, per review since highlights began; 0% = 100, 5%+ = 0. Subtracted from the score (up to −10), never averaged in — clean highlights are the norm, not a bonus.
Value (14%) — Customers’ own price verdicts (Great / Reasonable vs Overpriced) and Value highlights; 65% absolute (all “reasonable” ≈ 80, “great” = 100), the category percentile can only raise it.
Momentum (penalty, up to −10) — Penalises only a real slide: last-12-month average below lifetime (−0.5★ = 0). Still 4.8★+ over the last year, or steady/improving = 100. Subtracted from the score (up to −10), never averaged in.
Replies to reviews (7%) — How often the owner publicly replies to reviews under 5★ (1–4★). Needs 3+ such reviews, otherwise not counted; 65% absolute (80%+ replied = 100), the category percentile can only raise it.