
The Best Photographers
We graded 201 companies on seven things customers actually report: satisfaction, reliability, workmanship, value, momentum, track record and how owners handle complaints.
From 32,323 Google reviews of 201 top-rated photographers nationwide. Updated November 2, 2026.
Find the right company for your job
Pick the job — we re-rank companies by how customers rated that exact job.
Best photographers for photo booth rentals
Clear ✕ Mehraki ProductionsHow Job match is calculatedBuilt only from reviews Google tagged “Photo booth rentals”:Stars on this job 55%5.00★Number of such jobs 25%7Overall Experts Score 20%98Job match= 98Stars are pulled toward the category average (4.96★) when a company has few tagged jobs, so 3 perfect reviews don’t beat 80 great ones. 4.3★ scores 0, 5.0★ scores full. Volume is compared with the busiest company for this job.98
 Sarah Hedden PhotographyHow Job match is calculatedBuilt only from reviews Google tagged “Photo booth rentals”:Stars on this job 55%5.00★Number of such jobs 25%3Overall Experts Score 20%100Job match= 89Stars are pulled toward the category average (4.96★) when a company has few tagged jobs, so 3 perfect reviews don’t beat 80 great ones. 4.3★ scores 0, 5.0★ scores full. Volume is compared with the busiest company for this job.89
 All About Now PhotographyHow Job match is calculatedBuilt only from reviews Google tagged “Photo booth rentals”:Stars on this job 55%5.00★Number of such jobs 25%3Overall Experts Score 20%88Job match= 87Stars are pulled toward the category average (4.96★) when a company has few tagged jobs, so 3 perfect reviews don’t beat 80 great ones. 4.3★ scores 0, 5.0★ scores full. Volume is compared with the busiest company for this job.87
Job match = this company’s ★ on reviews Google tagged “Photo booth rentals” (shrunk toward the category average when there are few), how many such jobs it has done, and its overall Experts Score.
What customers said about photo booth rentals
Mehraki ProductionsAll services were extremely professional and definitely made my day super special with extra touches that were unexpected. Example - I received a lovely key chain that included a picture of me and my husband. Thank you for making my day one to remember.
Sarah Hedden PhotographySarah went above and beyond for our association's annual convention, and she was really fun to work with! In addition to showing up on time and getting the shots we asked for, her photos captured the essence of our event and our attendees at their best — smiling, learning, networking. I know we'll use these photos…
Mehraki ProductionsWe used this photo booth at a wedding last night and they were absolutely incredible! The team went above and beyond—not only taking amazing pictures, but acting as our ultimate hype crew. They paid attention to the smallest details, making sure our outfits were adjusted and checking that our necklaces were sitting…
Mehraki ProductionsHaving Mehraki Productions at our wedding reception was amazing! It was so much fun collaborating with Anthony and Phyllicia. They made the night unforgettable and our guests were so happy with the photo booth and all the props that they could use. Would definitely recommend getting the unlimited prints option!…
Mehraki ProductionsWe really enjoyed working with the Mehraki team for photo booth service at a recent wedding at Woodland Meadow Farms. Everyone enjoyed the photos and I would recommend them for a future event.
Mehraki ProductionsThis was our second year working with Mehraki Productions, and once again, they exceeded expectations. Their photo booth and roaming photography are always standout at our events. The lighting and image quality are exceptional, and the experience feels far more elevated than a typical photo booth. The props are…
Overall ratings
Experts Score 0–100Experts Score (0–100)Absolute quality first: recency-weighted star average (≈54%), share of 1–2★ reviews (≈24%), customers’ price verdicts (≈14%), owner replies to critical reviews (≈7%); minus up to 10 points each for complaints flagged in Google review highlights and for a real slide in recent ratings. Hover a company’s score on its page for the full breakdown. and a letter grade per factor (A = top 20% of photographers).
| # | Company | ScoreExperts Score (0–100)Absolute quality first: recency-weighted star average (≈54%), share of 1–2★ reviews (≈24%), customers’ price verdicts (≈14%), owner replies to critical reviews (≈7%); minus up to 10 points each for complaints flagged in Google review highlights and for a real slide in recent ratings. Hover a company’s score on its page for the full breakdown. | FactorsFactor grades, in orderSatisfaction (54%): Recency-weighted star average (2-year half-life), shrunk toward the category mean by review volume; the company’s own lifetime average as the prior; absolute: 4.0★ = 0, 5★ = 100.Reliability (24%): How rarely jobs go badly: share of 1–2★ reviews — 60% the last 24 months (or the 20 newest if fewer), 40% all-time; 0% = 100, 15%+ = 0; the category percentile can only raise it.Craft & service (0%): Google review highlights: Quality, Professionalism, Responsiveness, Punctuality — how rarely reviewers flag them as a negative, per review since highlights began; 0% = 100, 5%+ = 0. Subtracted from the score (up to −10), never averaged in — clean highlights are the norm, not a bonus.Value (14%): Customers’ own price verdicts (Great / Reasonable vs Overpriced) and Value highlights; 65% absolute (all “reasonable” ≈ 80, “great” = 100), the category percentile can only raise it.Momentum (0%): Penalises only a real slide: last-12-month average below lifetime (−0.5★ = 0). Still 4.8★+ over the last year, or steady/improving = 100. Subtracted from the score (up to −10), never averaged in.Replies to reviews (7%): How often the owner publicly replies to reviews under 5★ (1–4★). Needs 3+ such reviews, otherwise not counted; 65% absolute (80%+ replied = 100), the category percentile can only raise it.One letter per factor score: A = 80+, B = 60–79, C = 40–59, D = 20–39, F = below 20. | ★Google star rating as shown on Google Maps. | Typical billMedian bill customers of this company reported in their reviews (needs 3+ priced reviews). |
|---|---|---|---|---|---|
| 1 |  Joe and Jen PhotoSt. Louis Park, MN | A 100How the Experts Score is calculatedEach factor is scored 0–100 on absolute terms (standing in the category can only raise it), then weighted; problems flagged in review highlights or a recent slide in ratings are subtracted:Satisfaction 59%100+58.7Reliability 26%99+25.8Value 15%100+15.2Experts Score= 100Not enough data for replies to reviews; its weight is shared by the others.Grade A: A = 80+, B = 60–79, C = 40–59, D = 20–39. Needs 10+ reviews. | AAAAA– | 5.00 | — |
| 2 |  Jessica Knighton PhotographySt. Louis Park, MN | A 100How the Experts Score is calculatedEach factor is scored 0–100 on absolute terms (standing in the category can only raise it), then weighted; problems flagged in review highlights or a recent slide in ratings are subtracted:Satisfaction 69%100+69.2Reliability 31%99+30.5Experts Score= 100Not enough data for value, replies to reviews; its weight is shared by the others.Grade A: A = 80+, B = 60–79, C = 40–59, D = 20–39. Needs 10+ reviews. | AAA–A– | 5.00 | — |
| 3 | 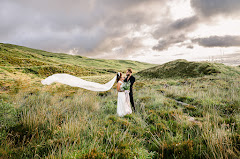 Erica Johanna PhotographySt. Louis Park, MN | A 100How the Experts Score is calculatedEach factor is scored 0–100 on absolute terms (standing in the category can only raise it), then weighted; problems flagged in review highlights or a recent slide in ratings are subtracted:Satisfaction 59%100+58.7Reliability 26%99+25.8Value 15%100+15.2Experts Score= 100Not enough data for replies to reviews; its weight is shared by the others.Grade A: A = 80+, B = 60–79, C = 40–59, D = 20–39. Needs 10+ reviews. | AAAAA– | 5.00 | — |
| 4 |  Helen Don PhotographyFrederick, MD | A 100How the Experts Score is calculatedEach factor is scored 0–100 on absolute terms (standing in the category can only raise it), then weighted; problems flagged in review highlights or a recent slide in ratings are subtracted:Satisfaction 59%100+58.7Reliability 26%99+25.8Value 15%100+15.2Experts Score= 100Not enough data for replies to reviews; its weight is shared by the others.Grade A: A = 80+, B = 60–79, C = 40–59, D = 20–39. Needs 10+ reviews. | AAAAA– | 5.00 | — |
| 5 |  Brad Barnwell Photography LLCFrederick, MD | A 100How the Experts Score is calculatedEach factor is scored 0–100 on absolute terms (standing in the category can only raise it), then weighted; problems flagged in review highlights or a recent slide in ratings are subtracted:Satisfaction 59%100+58.7Reliability 26%99+25.8Value 15%100+15.2Experts Score= 100Not enough data for replies to reviews; its weight is shared by the others.Grade A: A = 80+, B = 60–79, C = 40–59, D = 20–39. Needs 10+ reviews. | AAAAA– | 5.00 | — |
| 6 |  My Magic Mirror Photo BoothFrederick, MD | A 100How the Experts Score is calculatedEach factor is scored 0–100 on absolute terms (standing in the category can only raise it), then weighted; problems flagged in review highlights or a recent slide in ratings are subtracted:Satisfaction 69%100+69.2Reliability 31%99+30.5Experts Score= 100Not enough data for value, replies to reviews; its weight is shared by the others.Grade A: A = 80+, B = 60–79, C = 40–59, D = 20–39. Needs 10+ reviews. | AA––A– | 5.00 | — |
| 7 |  Jolie BoudoirTobaccoville, NC | A 100How the Experts Score is calculatedEach factor is scored 0–100 on absolute terms (standing in the category can only raise it), then weighted; problems flagged in review highlights or a recent slide in ratings are subtracted:Satisfaction 59%100+58.7Reliability 26%99+25.8Value 15%100+15.2Experts Score= 100Not enough data for replies to reviews; its weight is shared by the others.Grade A: A = 80+, B = 60–79, C = 40–59, D = 20–39. Needs 10+ reviews. | AAAAA– | 5.00 | — |
| 8 |  Jodie Brim Creative | Brand Photography + VideographyTobaccoville, NC | A 100How the Experts Score is calculatedEach factor is scored 0–100 on absolute terms (standing in the category can only raise it), then weighted; problems flagged in review highlights or a recent slide in ratings are subtracted:Satisfaction 59%100+58.7Reliability 26%99+25.8Value 15%100+15.2Experts Score= 100Not enough data for replies to reviews; its weight is shared by the others.Grade A: A = 80+, B = 60–79, C = 40–59, D = 20–39. Needs 10+ reviews. | AAAAA– | 5.00 | — |
| 9 |  Brand and Bloom PhotographyTobaccoville, NC | A 100How the Experts Score is calculatedEach factor is scored 0–100 on absolute terms (standing in the category can only raise it), then weighted; problems flagged in review highlights or a recent slide in ratings are subtracted:Satisfaction 59%100+58.7Reliability 26%99+25.8Value 15%100+15.2Experts Score= 100Not enough data for replies to reviews; its weight is shared by the others.Grade A: A = 80+, B = 60–79, C = 40–59, D = 20–39. Needs 10+ reviews. | AAAAA– | 5.00 | — |
| 10 |  Becca's PicsTobaccoville, NC | A 100How the Experts Score is calculatedEach factor is scored 0–100 on absolute terms (standing in the category can only raise it), then weighted; problems flagged in review highlights or a recent slide in ratings are subtracted:Satisfaction 59%100+58.7Reliability 26%99+25.8Value 15%100+15.2Experts Score= 100Not enough data for replies to reviews; its weight is shared by the others.Grade A: A = 80+, B = 60–79, C = 40–59, D = 20–39. Needs 10+ reviews. | AAAAA– | 5.00 | — |
| 11 |  Karen Salinas PhotographyTobaccoville, NC | A 100How the Experts Score is calculatedEach factor is scored 0–100 on absolute terms (standing in the category can only raise it), then weighted; problems flagged in review highlights or a recent slide in ratings are subtracted:Satisfaction 59%100+58.7Reliability 26%99+25.8Value 15%100+15.2Experts Score= 100Not enough data for replies to reviews; its weight is shared by the others.Grade A: A = 80+, B = 60–79, C = 40–59, D = 20–39. Needs 10+ reviews. | AAAAA– | 5.00 | — |
| 12 |  passion studiosElk Grove, CA | A 100How the Experts Score is calculatedEach factor is scored 0–100 on absolute terms (standing in the category can only raise it), then weighted; problems flagged in review highlights or a recent slide in ratings are subtracted:Satisfaction 59%100+58.7Reliability 26%99+25.8Value 15%100+15.2Experts Score= 100Not enough data for replies to reviews; its weight is shared by the others.Grade A: A = 80+, B = 60–79, C = 40–59, D = 20–39. Needs 10+ reviews. | AAAAA– | 5.00 | — |
What jobs cost
What customers paid, from the price Google asks reviewers to report.
| Job | Low25th percentile: 1 in 4 customers paid less than this. | TypicalMedian of the bill customers reported in their Google review (Google asks reviewers for a price range; we use the middle of each range). | High75th percentile: 1 in 4 customers paid more than this. | FairOf customers who rated the price, the share who chose “Great price” or “Reasonable” rather than “Overpriced”. |
|---|
Photographers at a glance
How the 201 photographers we rated compare, and what customers praise most.
Experts Score grades
A = score 80+, F = below 20.
- Grade A18793%
- Grade B115%
- Grade C31%
- Grade D00%
- Grade F00%
Google ratings
Average stars per company.
- 4.90★ and up18291%
- 4.80–4.89★94%
- 4.60–4.79★73%
- Below 4.60★31%
What customers praise
Share of Google review highlights.
- Quality3,10527%
- Professionalism3,29828%
- Responsiveness2,69323%
- Punctuality500%
- Value2,50722%
Was the price fair?
All price verdicts left with reviews.
- Great price2,15656%
- Reasonable1,52140%
- Overpriced612%
- Not sure1103%
Price verdicts by year
Share calling it great / reasonable / overpriced.
How we grade
Satisfaction (54%) — Recency-weighted star average (2-year half-life), shrunk toward the category mean by review volume; the company’s own lifetime average as the prior; absolute: 4.0★ = 0, 5★ = 100.
Reliability (24%) — How rarely jobs go badly: share of 1–2★ reviews — 60% the last 24 months (or the 20 newest if fewer), 40% all-time; 0% = 100, 15%+ = 0; the category percentile can only raise it.
Craft & service (penalty, up to −10) — Google review highlights: Quality, Professionalism, Responsiveness, Punctuality — how rarely reviewers flag them as a negative, per review since highlights began; 0% = 100, 5%+ = 0. Subtracted from the score (up to −10), never averaged in — clean highlights are the norm, not a bonus.
Value (14%) — Customers’ own price verdicts (Great / Reasonable vs Overpriced) and Value highlights; 65% absolute (all “reasonable” ≈ 80, “great” = 100), the category percentile can only raise it.
Momentum (penalty, up to −10) — Penalises only a real slide: last-12-month average below lifetime (−0.5★ = 0). Still 4.8★+ over the last year, or steady/improving = 100. Subtracted from the score (up to −10), never averaged in.
Replies to reviews (7%) — How often the owner publicly replies to reviews under 5★ (1–4★). Needs 3+ such reviews, otherwise not counted; 65% absolute (80%+ replied = 100), the category percentile can only raise it.