
The Best Photographers in Texas
We graded 30 companies on seven things customers actually report: satisfaction, reliability, workmanship, value, momentum, track record and how owners handle complaints.
From 32,323 Google reviews of 201 top-rated photographers nationwide; 30 of them in Texas. Updated November 2, 2026.
Find the right company for your job
Pick the job — we re-rank companies by how customers rated that exact job.
Best photographers in Texas for commercial photography
Clear ✕ TK ImagesHow Job match is calculatedBuilt only from reviews Google tagged “Commercial photography”:Stars on this job 55%4.94★Number of such jobs 25%18Overall Experts Score 20%97Job match= 95Stars are pulled toward the category average (4.96★) when a company has few tagged jobs, so 3 perfect reviews don’t beat 80 great ones. 4.3★ scores 0, 5.0★ scores full. Volume is compared with the busiest company for this job.95
 Rob Greer Photography HoustonHow Job match is calculatedBuilt only from reviews Google tagged “Commercial photography”:Stars on this job 55%5.00★Number of such jobs 25%4Overall Experts Score 20%100Job match= 87Stars are pulled toward the category average (4.96★) when a company has few tagged jobs, so 3 perfect reviews don’t beat 80 great ones. 4.3★ scores 0, 5.0★ scores full. Volume is compared with the busiest company for this job.87
 ZABE MediaHow Job match is calculatedBuilt only from reviews Google tagged “Commercial photography”:Stars on this job 55%5.00★Number of such jobs 25%3Overall Experts Score 20%100Job match= 84Stars are pulled toward the category average (4.96★) when a company has few tagged jobs, so 3 perfect reviews don’t beat 80 great ones. 4.3★ scores 0, 5.0★ scores full. Volume is compared with the busiest company for this job.84
Job match = this company’s ★ on reviews Google tagged “Commercial photography” (shrunk toward the category average when there are few), how many such jobs it has done, and its overall Experts Score.
What customers said about commercial photography
TK ImagesMichael Samadani at TK Images was fantastic to work with! He captured beautiful twilight exterior and backyard photos, along with an amazing highlight reel video. His eye for detail, creativity, and ability to capture the property at its absolute best really stood out. Michael is incredibly talented, professional,…
ZABE MediaMet Abriel at an investor meetup and the guy's passion for his work made me want to give him a shot, even though I already had a couple of photography vendors I was happy with. Glad I did. He and Isaiah did an amazing job on aerial photos, 3D walkthrough, and video. Professional, easy to work with, and turnaround…
Rob Greer Photography HoustonRob is truly the best of the best. He takes the most gorgeous, editorial-style headshots (a style that is difficult to find), and is able to capture authentic emotion in his subjects. Not only that, but he is also a highly skilled commercial photographer with the remarkable ability to find art in the everyday. Rob's…
TK ImagesWe recently switched to TK Images for the Matterport walkthroughs of our homes under construction, and it has been one of the best decisions we've made! Their turnaround time is incredibly fast, and every member of their team has been friendly, professional, and a pleasure to work with. We truly appreciate their…
TK ImagesI have been working with TK Images for years. They always do a great job with our listing photography and we’re so happy to have them as apart of our team.
TK ImagesI have worked with TK for many years, and they have always provided me with fantastic experiences, flexbility, high quality work, and a willingness to correct any concerns brought to their attention. This is why I will continue to trust them with my listing photography.
Overall ratings
Experts Score 0–100Experts Score (0–100)Absolute quality first: recency-weighted star average (≈54%), share of 1–2★ reviews (≈24%), customers’ price verdicts (≈14%), owner replies to critical reviews (≈7%); minus up to 10 points each for complaints flagged in Google review highlights and for a real slide in recent ratings. Hover a company’s score on its page for the full breakdown. and a letter grade per factor (A = top 20% of photographers).
| # | Company | ScoreExperts Score (0–100)Absolute quality first: recency-weighted star average (≈54%), share of 1–2★ reviews (≈24%), customers’ price verdicts (≈14%), owner replies to critical reviews (≈7%); minus up to 10 points each for complaints flagged in Google review highlights and for a real slide in recent ratings. Hover a company’s score on its page for the full breakdown. | FactorsFactor grades, in orderSatisfaction (54%): Recency-weighted star average (2-year half-life), shrunk toward the category mean by review volume; the company’s own lifetime average as the prior; absolute: 4.0★ = 0, 5★ = 100.Reliability (24%): How rarely jobs go badly: share of 1–2★ reviews — 60% the last 24 months (or the 20 newest if fewer), 40% all-time; 0% = 100, 15%+ = 0; the category percentile can only raise it.Craft & service (0%): Google review highlights: Quality, Professionalism, Responsiveness, Punctuality — how rarely reviewers flag them as a negative, per review since highlights began; 0% = 100, 5%+ = 0. Subtracted from the score (up to −10), never averaged in — clean highlights are the norm, not a bonus.Value (14%): Customers’ own price verdicts (Great / Reasonable vs Overpriced) and Value highlights; 65% absolute (all “reasonable” ≈ 80, “great” = 100), the category percentile can only raise it.Momentum (0%): Penalises only a real slide: last-12-month average below lifetime (−0.5★ = 0). Still 4.8★+ over the last year, or steady/improving = 100. Subtracted from the score (up to −10), never averaged in.Replies to reviews (7%): How often the owner publicly replies to reviews under 5★ (1–4★). Needs 3+ such reviews, otherwise not counted; 65% absolute (80%+ replied = 100), the category percentile can only raise it.One letter per factor score: A = 80+, B = 60–79, C = 40–59, D = 20–39, F = below 20. | ★Google star rating as shown on Google Maps. | Typical billMedian bill customers of this company reported in their reviews (needs 3+ priced reviews). |
|---|---|---|---|---|---|
| 1 |  FAMILY BEACH PHOTOS by PEDRO RIVAS PHOTOGRAPHYGalveston, TX | A 100How the Experts Score is calculatedEach factor is scored 0–100 on absolute terms (standing in the category can only raise it), then weighted; problems flagged in review highlights or a recent slide in ratings are subtracted:Satisfaction 59%100+58.7Reliability 26%99+25.8Value 15%100+15.2Experts Score= 100Not enough data for replies to reviews; its weight is shared by the others.Grade A: A = 80+, B = 60–79, C = 40–59, D = 20–39. Needs 10+ reviews. | AA–AA– | 5.00 | — |
| 2 |  Barefoot Weddings - GalvestonGalveston, TX | A 100How the Experts Score is calculatedEach factor is scored 0–100 on absolute terms (standing in the category can only raise it), then weighted; problems flagged in review highlights or a recent slide in ratings are subtracted:Satisfaction 59%100+58.7Reliability 26%99+25.8Value 15%100+15.2Experts Score= 100Not enough data for replies to reviews; its weight is shared by the others.Grade A: A = 80+, B = 60–79, C = 40–59, D = 20–39. Needs 10+ reviews. | AA–AA– | 5.00 | — |
| 3 | 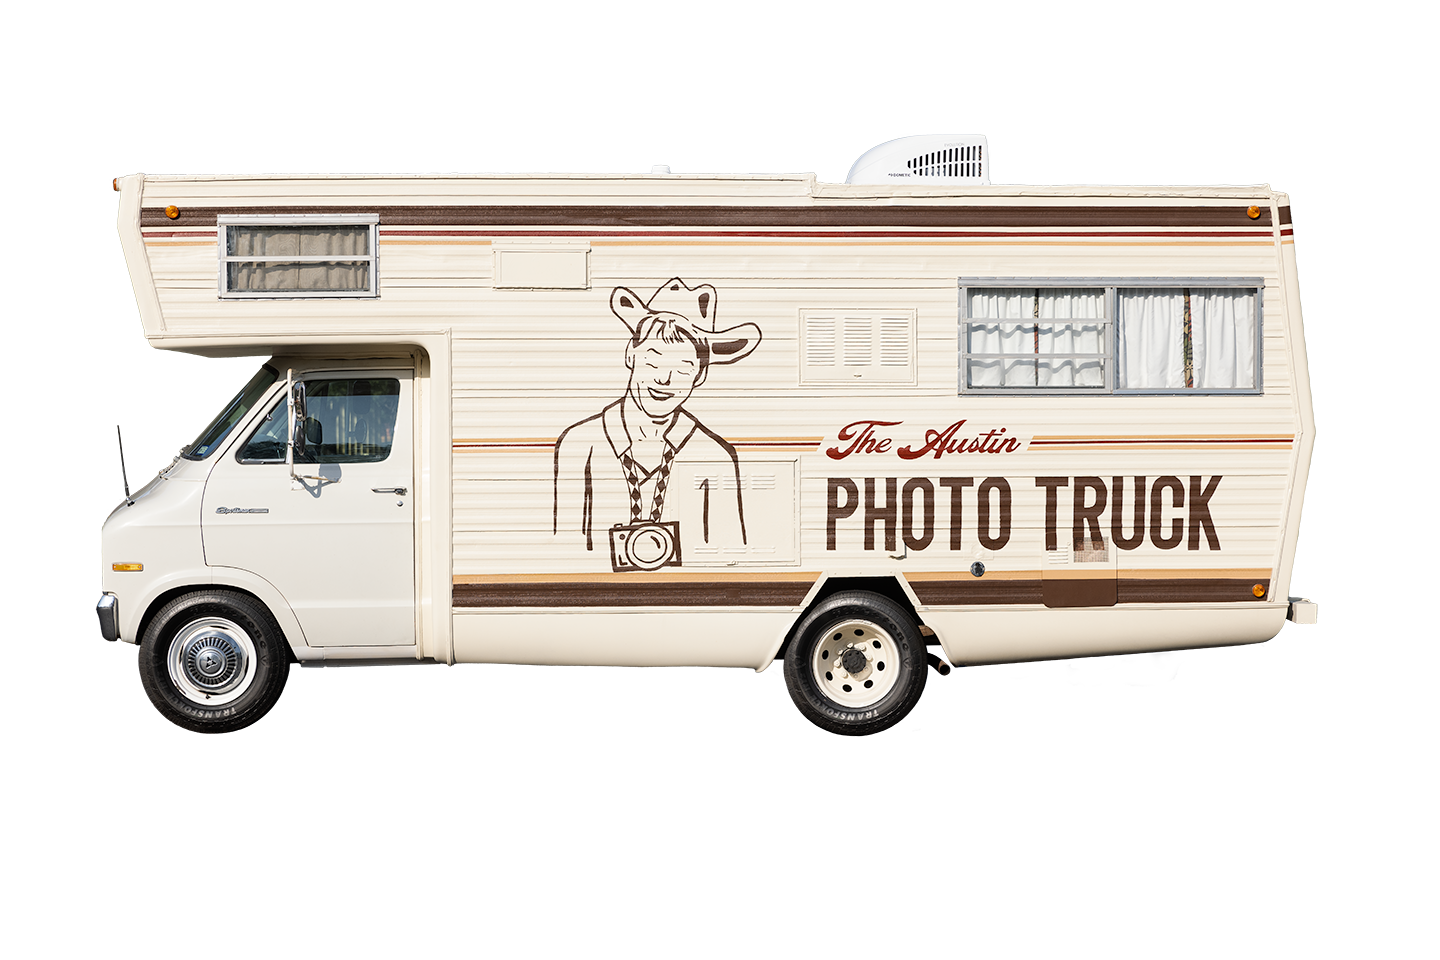 The Austin Photo TruckAustin, TX | A 100How the Experts Score is calculatedEach factor is scored 0–100 on absolute terms (standing in the category can only raise it), then weighted; problems flagged in review highlights or a recent slide in ratings are subtracted:Satisfaction 59%100+58.7Reliability 26%99+25.8Value 15%100+15.2Experts Score= 100Not enough data for replies to reviews; its weight is shared by the others.Grade A: A = 80+, B = 60–79, C = 40–59, D = 20–39. Needs 10+ reviews. | AAAAA– | 5.00 | — |
| 4 |  Zach Brigham PhotographyAustin, TX | A 100How the Experts Score is calculatedEach factor is scored 0–100 on absolute terms (standing in the category can only raise it), then weighted; problems flagged in review highlights or a recent slide in ratings are subtracted:Satisfaction 59%100+58.7Reliability 26%100+26.1Value 15%100+15.2Experts Score= 100Not enough data for replies to reviews; its weight is shared by the others.Grade A: A = 80+, B = 60–79, C = 40–59, D = 20–39. Needs 10+ reviews. | AAAAA– | 5.00 | — |
| 5 | ZABE MediaAustin, TX | A 100How the Experts Score is calculatedEach factor is scored 0–100 on absolute terms (standing in the category can only raise it), then weighted; problems flagged in review highlights or a recent slide in ratings are subtracted:Satisfaction 59%100+58.7Reliability 26%100+26.1Value 15%100+15.2Experts Score= 100Not enough data for replies to reviews; its weight is shared by the others.Grade A: A = 80+, B = 60–79, C = 40–59, D = 20–39. Needs 10+ reviews. | AA–AA– | 5.00 | — |
| 6 | Rob Greer Photography HoustonHouston, TX | A 100How the Experts Score is calculatedEach factor is scored 0–100 on absolute terms (standing in the category can only raise it), then weighted; problems flagged in review highlights or a recent slide in ratings are subtracted:Satisfaction 59%100+58.7Reliability 26%99+25.8Value 15%100+15.2Experts Score= 100Not enough data for replies to reviews; its weight is shared by the others.Grade A: A = 80+, B = 60–79, C = 40–59, D = 20–39. Needs 10+ reviews. | AAAAA– | 5.00 | — |
| 7 |  Above & Beyond ConciergeGalveston, TX | A 99How the Experts Score is calculatedEach factor is scored 0–100 on absolute terms (standing in the category can only raise it), then weighted; problems flagged in review highlights or a recent slide in ratings are subtracted:Satisfaction 69%99+68.5Reliability 31%98+30.2Experts Score= 99Not enough data for value, replies to reviews; its weight is shared by the others.Grade A: A = 80+, B = 60–79, C = 40–59, D = 20–39. Needs 10+ reviews. | AA––A– | 5.00 | — |
| 8 |  Vivezza PhotographyHouston, TX | A 99How the Experts Score is calculatedEach factor is scored 0–100 on absolute terms (standing in the category can only raise it), then weighted; problems flagged in review highlights or a recent slide in ratings are subtracted:Satisfaction 59%99+58.1Reliability 26%97+25.3Value 15%100+15.2Experts Score= 99Not enough data for replies to reviews; its weight is shared by the others.Grade A: A = 80+, B = 60–79, C = 40–59, D = 20–39. Needs 10+ reviews. | AA–AA– | 4.99 | — |
| 9 |  Ashkan Image PhotographyHouston, TX | A 99How the Experts Score is calculatedEach factor is scored 0–100 on absolute terms (standing in the category can only raise it), then weighted; problems flagged in review highlights or a recent slide in ratings are subtracted:Satisfaction 59%99+58.1Reliability 26%99+25.8Value 15%100+15.2Experts Score= 99Not enough data for replies to reviews; its weight is shared by the others.Grade A: A = 80+, B = 60–79, C = 40–59, D = 20–39. Needs 10+ reviews. | AAAAA– | 4.99 | — |
| 10 |  Megan Murray PhotographyHouston, TX | A 99How the Experts Score is calculatedEach factor is scored 0–100 on absolute terms (standing in the category can only raise it), then weighted; problems flagged in review highlights or a recent slide in ratings are subtracted:Satisfaction 59%99+58.1Reliability 26%99+25.8Value 15%100+15.2Experts Score= 99Not enough data for replies to reviews; its weight is shared by the others.Grade A: A = 80+, B = 60–79, C = 40–59, D = 20–39. Needs 10+ reviews. | AAAAA– | 4.99 | — |
| 11 |  FotoLab StudioHouston, TX | A 99How the Experts Score is calculatedEach factor is scored 0–100 on absolute terms (standing in the category can only raise it), then weighted; problems flagged in review highlights or a recent slide in ratings are subtracted:Satisfaction 55%99+54Reliability 24%99+24Value 14%100+14.1Replies to reviews 7%100+7.1Experts Score= 99Grade A: A = 80+, B = 60–79, C = 40–59, D = 20–39. Needs 10+ reviews. | AA–AAA | 4.99 | — |
| 12 |  Austin Real Estate Photography - Austin 360 PhotographyAustin, TX | A 98How the Experts Score is calculatedEach factor is scored 0–100 on absolute terms (standing in the category can only raise it), then weighted; problems flagged in review highlights or a recent slide in ratings are subtracted:Satisfaction 55%99+54Reliability 24%99+24Value 14%100+14.1Replies to reviews 7%89+6.3Experts Score= 98Grade A: A = 80+, B = 60–79, C = 40–59, D = 20–39. Needs 10+ reviews. | AAAAAA | 4.98 | — |
What jobs cost
What customers paid, from the price Google asks reviewers to report.
| Job | Low25th percentile: 1 in 4 customers paid less than this. | TypicalMedian of the bill customers reported in their Google review (Google asks reviewers for a price range; we use the middle of each range). | High75th percentile: 1 in 4 customers paid more than this. | FairOf customers who rated the price, the share who chose “Great price” or “Reasonable” rather than “Overpriced”. |
|---|
Photographers in Texas at a glance
How the 30 photographers we rated in Texas compare, and what customers praise most.
Experts Score grades
A = score 80+, F = below 20.
- Grade A2997%
- Grade B00%
- Grade C13%
- Grade D00%
- Grade F00%
Google ratings
Average stars per company.
- 4.90★ and up2790%
- 4.80–4.89★27%
- 4.60–4.79★00%
- Below 4.60★13%
What customers praise
Share of Google review highlights.
- Quality3,10527%
- Professionalism3,29828%
- Responsiveness2,69323%
- Punctuality500%
- Value2,50722%
Was the price fair?
All price verdicts left with reviews.
- Great price2,15656%
- Reasonable1,52140%
- Overpriced612%
- Not sure1103%
Price verdicts by year
Share calling it great / reasonable / overpriced.
How we grade
Satisfaction (54%) — Recency-weighted star average (2-year half-life), shrunk toward the category mean by review volume; the company’s own lifetime average as the prior; absolute: 4.0★ = 0, 5★ = 100.
Reliability (24%) — How rarely jobs go badly: share of 1–2★ reviews — 60% the last 24 months (or the 20 newest if fewer), 40% all-time; 0% = 100, 15%+ = 0; the category percentile can only raise it.
Craft & service (penalty, up to −10) — Google review highlights: Quality, Professionalism, Responsiveness, Punctuality — how rarely reviewers flag them as a negative, per review since highlights began; 0% = 100, 5%+ = 0. Subtracted from the score (up to −10), never averaged in — clean highlights are the norm, not a bonus.
Value (14%) — Customers’ own price verdicts (Great / Reasonable vs Overpriced) and Value highlights; 65% absolute (all “reasonable” ≈ 80, “great” = 100), the category percentile can only raise it.
Momentum (penalty, up to −10) — Penalises only a real slide: last-12-month average below lifetime (−0.5★ = 0). Still 4.8★+ over the last year, or steady/improving = 100. Subtracted from the score (up to −10), never averaged in.
Replies to reviews (7%) — How often the owner publicly replies to reviews under 5★ (1–4★). Needs 3+ such reviews, otherwise not counted; 65% absolute (80%+ replied = 100), the category percentile can only raise it.