
The Best Tire Shops in Corona, CA
We graded 10 companies on seven things customers actually report: satisfaction, reliability, workmanship, value, momentum, track record and how owners handle complaints.
From 80,911 Google reviews of 168 top-rated tire shops nationwide; 10 of them in Corona, CA. Updated November 11, 2026.
Find the right company for your job
Pick the job — we re-rank companies by how customers rated that exact job.
Best tire shops in Corona for wheel alignment
Clear ✕ Firestone Complete Auto CareHow Job match is calculatedBuilt only from reviews Google tagged “Wheel alignment”:Stars on this job 55%4.93★Number of such jobs 25%111Overall Experts Score 20%86Job match= 91Stars are pulled toward the category average (4.79★) when a company has few tagged jobs, so 3 perfect reviews don’t beat 80 great ones. 4.3★ scores 0, 5.0★ scores full. Volume is compared with the busiest company for this job.91
 Harvey's AutotechHow Job match is calculatedBuilt only from reviews Google tagged “Wheel alignment”:Stars on this job 55%5.00★Number of such jobs 25%21Overall Experts Score 20%85Job match= 84Stars are pulled toward the category average (4.79★) when a company has few tagged jobs, so 3 perfect reviews don’t beat 80 great ones. 4.3★ scores 0, 5.0★ scores full. Volume is compared with the busiest company for this job.84
 Precision Import Auto RepairHow Job match is calculatedBuilt only from reviews Google tagged “Wheel alignment”:Stars on this job 55%5.00★Number of such jobs 25%10Overall Experts Score 20%89Job match= 78Stars are pulled toward the category average (4.79★) when a company has few tagged jobs, so 3 perfect reviews don’t beat 80 great ones. 4.3★ scores 0, 5.0★ scores full. Volume is compared with the busiest company for this job.78
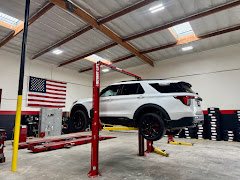 Koritas TiresHow Job match is calculatedBuilt only from reviews Google tagged “Wheel alignment”:Stars on this job 55%5.00★Number of such jobs 25%6Overall Experts Score 20%99Job match= 76Stars are pulled toward the category average (4.79★) when a company has few tagged jobs, so 3 perfect reviews don’t beat 80 great ones. 4.3★ scores 0, 5.0★ scores full. Volume is compared with the busiest company for this job.76
Job match = this company’s ★ on reviews Google tagged “Wheel alignment” (shrunk toward the category average when there are few), how many such jobs it has done, and its overall Experts Score.
What customers said about wheel alignment
Firestone Complete Auto CareElias and Marelyn were so great and took care of me in 2 hours. Chris also got me checked in over the phone, wonderful customer service! Got four new wheels and alignment, so happy with the job they did!
Precision Import Auto RepairThey are completely Honest. Could have sold us anything and they didn’t. Totally trust them and plan on using only them from now on.
Koritas TiresThis shop is top notch! You want someone to go above and beyond? This is where it’s at! Jason and his staff are exceptional at what they do! They get exactly what you need done in a timely manner. I guarantee you won’t have any problems after they’re done!!
Firestone Complete Auto CareBeen coming here for years with different vehicles… Today I purchased the lifetime wheel alignment for my 24 Sonata… Great service with the manager Elias…😎👍
Precision Import Auto RepairEvery time I've used Precision Import Auto, the work was done with quality and on time. The staff is very professional and informative. Plus the prices are affordable and fair. I have recommended this establishment to family and friends.
Koritas TiresI had my alignment done there. The service and quality of work was excellent. There was a slight hiccup with the steering wheel being off center, but my vehicle had some modifications so it was understandable. They were able sort it out and get it get fixed. They are knowledgeable and well experienced, so if they…
Overall ratings
Experts Score 0–100Experts Score (0–100)Absolute quality first: recency-weighted star average (≈54%), share of 1–2★ reviews (≈24%), customers’ price verdicts (≈14%), owner replies to critical reviews (≈7%); minus up to 10 points each for complaints flagged in Google review highlights and for a real slide in recent ratings. Hover a company’s score on its page for the full breakdown. and a letter grade per factor (A = top 20% of tire shops).
| # | Company | ScoreExperts Score (0–100)Absolute quality first: recency-weighted star average (≈54%), share of 1–2★ reviews (≈24%), customers’ price verdicts (≈14%), owner replies to critical reviews (≈7%); minus up to 10 points each for complaints flagged in Google review highlights and for a real slide in recent ratings. Hover a company’s score on its page for the full breakdown. | FactorsFactor grades, in orderSatisfaction (54%): Recency-weighted star average (2-year half-life), shrunk toward the category mean by review volume; the company’s own lifetime average as the prior; absolute: 4.0★ = 0, 5★ = 100.Reliability (24%): How rarely jobs go badly: share of 1–2★ reviews — 60% the last 24 months (or the 20 newest if fewer), 40% all-time; 0% = 100, 15%+ = 0; the category percentile can only raise it.Craft & service (0%): Google review highlights: Quality, Professionalism, Responsiveness, Punctuality — how rarely reviewers flag them as a negative, per review since highlights began; 0% = 100, 5%+ = 0. Subtracted from the score (up to −10), never averaged in — clean highlights are the norm, not a bonus.Value (14%): Customers’ own price verdicts (Great / Reasonable vs Overpriced) and Value highlights; 65% absolute (all “reasonable” ≈ 80, “great” = 100), the category percentile can only raise it.Momentum (0%): Penalises only a real slide: last-12-month average below lifetime (−0.5★ = 0). Still 4.8★+ over the last year, or steady/improving = 100. Subtracted from the score (up to −10), never averaged in.Replies to reviews (7%): How often the owner publicly replies to reviews under 5★ (1–4★). Needs 3+ such reviews, otherwise not counted; 65% absolute (80%+ replied = 100), the category percentile can only raise it.One letter per factor score: A = 80+, B = 60–79, C = 40–59, D = 20–39, F = below 20. | ★Google star rating as shown on Google Maps. | Typical billMedian bill customers of this company reported in their reviews (needs 3+ priced reviews). |
|---|---|---|---|---|---|
| 1 | Koritas TiresCorona, CA | A 99How the Experts Score is calculatedEach factor is scored 0–100 on absolute terms (standing in the category can only raise it), then weighted; problems flagged in review highlights or a recent slide in ratings are subtracted:Satisfaction 59%99+58.1Reliability 26%97+25.3Value 15%100+15.2Experts Score= 99Not enough data for replies to reviews; its weight is shared by the others.Grade A: A = 80+, B = 60–79, C = 40–59, D = 20–39. Needs 10+ reviews. | AA–AA– | 5.00 | — |
| 2 | 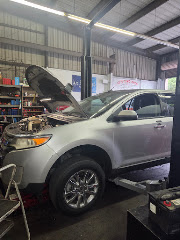 Auto Clinic CoronaCorona, CA | A 95How the Experts Score is calculatedEach factor is scored 0–100 on absolute terms (standing in the category can only raise it), then weighted; problems flagged in review highlights or a recent slide in ratings are subtracted:Satisfaction 59%95+55.8Reliability 26%91+23.7Value 15%100+15.2Experts Score= 95Not enough data for replies to reviews; its weight is shared by the others.Grade A: A = 80+, B = 60–79, C = 40–59, D = 20–39. Needs 10+ reviews. | AA–AA– | 4.96 | — |
| 3 |  Aaron Kia of Corona Service DepartmentCorona, CA | A 93How the Experts Score is calculatedEach factor is scored 0–100 on absolute terms (standing in the category can only raise it), then weighted; problems flagged in review highlights or a recent slide in ratings are subtracted:Satisfaction 55%90+49.1Reliability 24%93+22.5Value 14%100+14.1Replies to reviews 7%100+7.1Experts Score= 93Grade A: A = 80+, B = 60–79, C = 40–59, D = 20–39. Needs 10+ reviews. | AA–AAA | 4.90 | — |
| 4 |  J & L Car CareCorona, CA | A 91How the Experts Score is calculatedEach factor is scored 0–100 on absolute terms (standing in the category can only raise it), then weighted; problems flagged in review highlights or a recent slide in ratings are subtracted:Satisfaction 55%94+51.3Reliability 24%91+22.1Value 14%100+14.1Replies to reviews 7%55+3.9Craft & service penalty94−0.6Experts Score= 91Grade A: A = 80+, B = 60–79, C = 40–59, D = 20–39. Needs 10+ reviews. | AAAAAC | 4.90 | — |
| 5 | Precision Import Auto RepairCorona, CA | A 89How the Experts Score is calculatedEach factor is scored 0–100 on absolute terms (standing in the category can only raise it), then weighted; problems flagged in review highlights or a recent slide in ratings are subtracted:Satisfaction 55%93+50.7Reliability 24%92+22.3Value 14%100+14.1Replies to reviews 7%30+2.1Craft & service penalty96−0.4Experts Score= 89Grade A: A = 80+, B = 60–79, C = 40–59, D = 20–39. Needs 10+ reviews. | AAAAAD | 4.88 | — |
| 6 |  Team Car CareCorona, CA | A 86How the Experts Score is calculatedEach factor is scored 0–100 on absolute terms (standing in the category can only raise it), then weighted; problems flagged in review highlights or a recent slide in ratings are subtracted:Satisfaction 55%90+49.1Reliability 24%86+20.8Value 14%100+14.1Replies to reviews 7%38+2.7Craft & service penalty91−0.9Experts Score= 86Grade A: A = 80+, B = 60–79, C = 40–59, D = 20–39. Needs 10+ reviews. | AAAAAD | 4.83 | — |
| 7 | 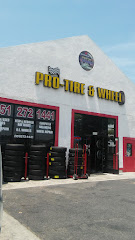 Pro Tire & WheelCorona, CA | A 86How the Experts Score is calculatedEach factor is scored 0–100 on absolute terms (standing in the category can only raise it), then weighted; problems flagged in review highlights or a recent slide in ratings are subtracted:Satisfaction 55%91+49.6Reliability 24%90+21.8Value 14%96+13.6Replies to reviews 7%12+0.8Experts Score= 86Grade A: A = 80+, B = 60–79, C = 40–59, D = 20–39. Needs 10+ reviews. | AA–AAF | 4.85 | — |
| 8 | Firestone Complete Auto CareCorona, CA | A 86How the Experts Score is calculatedEach factor is scored 0–100 on absolute terms (standing in the category can only raise it), then weighted; problems flagged in review highlights or a recent slide in ratings are subtracted:Satisfaction 55%88+48Reliability 24%81+19.6Value 14%100+14.1Replies to reviews 7%56+4Experts Score= 86Grade A: A = 80+, B = 60–79, C = 40–59, D = 20–39. Needs 10+ reviews. | AA–AAC | 4.71 | — |
| 9 | Harvey's AutotechCorona, CA | A 85How the Experts Score is calculatedEach factor is scored 0–100 on absolute terms (standing in the category can only raise it), then weighted; problems flagged in review highlights or a recent slide in ratings are subtracted:Satisfaction 55%86+46.9Reliability 24%77+18.7Value 14%97+13.7Replies to reviews 7%90+6.4Craft & service penalty89−1.1Experts Score= 85Grade A: A = 80+, B = 60–79, C = 40–59, D = 20–39. Needs 10+ reviews. | ABAAAA | 4.86 | — |
| 10 |  Corona Auto Repair Services C A R S CARSCorona, CA | B 70How the Experts Score is calculatedEach factor is scored 0–100 on absolute terms (standing in the category can only raise it), then weighted; problems flagged in review highlights or a recent slide in ratings are subtracted:Satisfaction 55%78+42.5Reliability 24%47+11.4Value 14%100+14.1Replies to reviews 7%26+1.8Experts Score= 70Grade B: A = 80+, B = 60–79, C = 40–59, D = 20–39. Needs 10+ reviews. | BCAAAD | 4.85 | — |
What jobs cost
What customers paid, from the price Google asks reviewers to report.
| Job | Low25th percentile: 1 in 4 customers paid less than this. | TypicalMedian of the bill customers reported in their Google review (Google asks reviewers for a price range; we use the middle of each range). | High75th percentile: 1 in 4 customers paid more than this. | FairOf customers who rated the price, the share who chose “Great price” or “Reasonable” rather than “Overpriced”. |
|---|
Tire Shops in Corona, CA at a glance
How the 10 tire shops we rated in Corona, CA compare, and what customers praise most.
Experts Score grades
A = score 80+, F = below 20.
- Grade A990%
- Grade B110%
- Grade C00%
- Grade D00%
- Grade F00%
Google ratings
Average stars per company.
- 4.90★ and up440%
- 4.80–4.89★550%
- 4.60–4.79★110%
- Below 4.60★00%
What customers praise
Share of Google review highlights.
- Quality1,29726%
- Professionalism1,46630%
- Responsiveness00%
- Punctuality1,04521%
- Value1,13823%
Was the price fair?
All price verdicts left with reviews.
- Great price5,74458%
- Reasonable3,78538%
- Overpriced1622%
- Not sure1852%
Price verdicts by year
Share calling it great / reasonable / overpriced.
How we grade
Satisfaction (54%) — Recency-weighted star average (2-year half-life), shrunk toward the category mean by review volume; the company’s own lifetime average as the prior; absolute: 4.0★ = 0, 5★ = 100.
Reliability (24%) — How rarely jobs go badly: share of 1–2★ reviews — 60% the last 24 months (or the 20 newest if fewer), 40% all-time; 0% = 100, 15%+ = 0; the category percentile can only raise it.
Craft & service (penalty, up to −10) — Google review highlights: Quality, Professionalism, Responsiveness, Punctuality — how rarely reviewers flag them as a negative, per review since highlights began; 0% = 100, 5%+ = 0. Subtracted from the score (up to −10), never averaged in — clean highlights are the norm, not a bonus.
Value (14%) — Customers’ own price verdicts (Great / Reasonable vs Overpriced) and Value highlights; 65% absolute (all “reasonable” ≈ 80, “great” = 100), the category percentile can only raise it.
Momentum (penalty, up to −10) — Penalises only a real slide: last-12-month average below lifetime (−0.5★ = 0). Still 4.8★+ over the last year, or steady/improving = 100. Subtracted from the score (up to −10), never averaged in.
Replies to reviews (7%) — How often the owner publicly replies to reviews under 5★ (1–4★). Needs 3+ such reviews, otherwise not counted; 65% absolute (80%+ replied = 100), the category percentile can only raise it.