
The Best Tutors in Kentucky
We graded 9 companies on seven things customers actually report: satisfaction, reliability, workmanship, value, momentum, track record and how owners handle complaints.
From 4,893 Google reviews of 78 top-rated tutors nationwide; 9 of them in Kentucky. Updated October 25, 2026.
Find the right company for your job
Pick the job — we re-rank companies by how customers rated that exact job.
Overall ratings
Experts Score 0–100Experts Score (0–100)Weighted average of 7 percentiles vs other companies in the category: satisfaction 35%, workmanship 20%, reliability 15%, value 10%, momentum 8%, track record 7%, owner replies 5%. Hover a company’s score on its page for the full breakdown. and a letter grade per factor (A = top 20% of tutors).
| # | Company | ScoreExperts Score (0–100)Weighted average of 7 percentiles vs other companies in the category: satisfaction 35%, workmanship 20%, reliability 15%, value 10%, momentum 8%, track record 7%, owner replies 5%. Hover a company’s score on its page for the full breakdown. | FactorsFactor grades, in orderSatisfaction (35%): Recency-weighted star average (2-year half-life), shrunk toward the category mean by review volume.Reliability (15%): How rarely jobs go badly: share of 1–2★ reviews in the last 24 months (fewer = better).Craft & service (20%): Google review highlights: Quality, Professionalism, Responsiveness, Punctuality — net praise per review.Value (10%): Customers’ own price verdicts (Great / Reasonable vs Overpriced) and Value highlights.Momentum (8%): Last 12 months vs lifetime average — improving or slipping.Track record (7%): Review volume and years with reviews.Accountability (5%): Owner replies to 1–3★ reviews.One letter per factor, by percentile among peers: A = top 20%, B = next 20%, and so on. | ★Google star rating as shown on Google Maps. | Typical billMedian bill customers of this company reported in their reviews (needs 3+ priced reviews). |
|---|---|---|---|---|---|
| 1 |  MathnasiumOrchard Grass Hills, KY | B 79How the Experts Score is calculatedEach factor is a percentile (0–100) against the other companies in this category, then weighted:Satisfaction 44%99+43.3Reliability 19%98+18.4Value 13%56+7Momentum 10%31+3.1Track record 9%46+4Accountability 6%51+3.2Experts Score= 79Not enough data for craft & service; its weight is shared by the others.Grade B: A = 80+, B = 60–79, C = 40–59, D = 20–39. Needs 10+ reviews. | AA–CDCC | 5.00 | — |
| 2 | 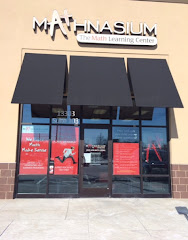 MathnasiumOrchard Grass Hills, KY | B 71How the Experts Score is calculatedEach factor is a percentile (0–100) against the other companies in this category, then weighted:Satisfaction 44%83+36.3Reliability 19%94+17.6Value 13%8+1Momentum 10%78+7.8Track record 9%85+7.4Accountability 6%21+1.3Experts Score= 71Not enough data for craft & service; its weight is shared by the others.Grade B: A = 80+, B = 60–79, C = 40–59, D = 20–39. Needs 10+ reviews. | AA–FBAD | 4.92 | — |
| 3 |  Equitas PrepOrchard Grass Hills, KY | B 61How the Experts Score is calculatedEach factor is a percentile (0–100) against the other companies in this category, then weighted:Satisfaction 50%78+39Reliability 21%63+13.5Momentum 11%31+3.5Track record 10%11+1.1Accountability 7%51+3.6Experts Score= 61Not enough data for craft & service, value; its weight is shared by the others.Grade B: A = 80+, B = 60–79, C = 40–59, D = 20–39. Needs 10+ reviews. | BB––DFC | 5.00 | — |
| 4 |  LearningRx LouisvilleOrchard Grass Hills, KY | C 57How the Experts Score is calculatedEach factor is a percentile (0–100) against the other companies in this category, then weighted:Satisfaction 35%54+18.9Reliability 15%43+6.5Craft & service 20%82+16.4Value 10%35+3.5Momentum 8%59+4.7Track record 7%71+5Accountability 5%51+2.6Experts Score= 57Grade C: A = 80+, B = 60–79, C = 40–59, D = 20–39. Needs 10+ reviews. | CCADCBC | 4.97 | — |
| 5 |  Kumon Math and Reading Center of ProspectOrchard Grass Hills, KY | C 54How the Experts Score is calculatedEach factor is a percentile (0–100) against the other companies in this category, then weighted:Satisfaction 50%37+18.5Reliability 21%67+14.4Momentum 11%99+11.3Track record 10%30+3Accountability 7%94+6.7Experts Score= 54Not enough data for craft & service, value; its weight is shared by the others.Grade C: A = 80+, B = 60–79, C = 40–59, D = 20–39. Needs 10+ reviews. | DB––ADA | 4.70 | — |
| 6 |  Russian School of Mathematics - RSM LouisvilleOrchard Grass Hills, KY | C 46How the Experts Score is calculatedEach factor is a percentile (0–100) against the other companies in this category, then weighted:Satisfaction 39%47+18.3Reliability 17%48+8Craft & service 22%30+6.7Momentum 9%94+8.4Track record 8%61+4.7Accountability 6%5+0.3Experts Score= 46Not enough data for value; its weight is shared by the others.Grade C: A = 80+, B = 60–79, C = 40–59, D = 20–39. Needs 10+ reviews. | CCD–ABF | 4.73 | — |
| 7 |  LangsfordOrchard Grass Hills, KY | C 40How the Experts Score is calculatedEach factor is a percentile (0–100) against the other companies in this category, then weighted:Satisfaction 35%12+4.2Reliability 15%3+0.5Craft & service 20%82+16.4Value 10%59+5.9Momentum 8%80+6.4Track record 7%88+6.2Accountability 5%2+0.1Experts Score= 40Grade C: A = 80+, B = 60–79, C = 40–59, D = 20–39. Needs 10+ reviews. | FFACAAF | 4.90 | — |
| 8 |  Kumon Math and Reading Center of MiddletownOrchard Grass Hills, KY | D 35How the Experts Score is calculatedEach factor is a percentile (0–100) against the other companies in this category, then weighted:Satisfaction 39%33+12.8Reliability 17%19+3.2Craft & service 22%8+1.8Momentum 9%66+5.9Track record 8%76+5.9Accountability 6%97+5.4Experts Score= 35Not enough data for value; its weight is shared by the others.Grade D: A = 80+, B = 60–79, C = 40–59, D = 20–39. Needs 10+ reviews. | DFF–BBA | 4.88 | — |
| 9 |  100% Spanish Language Center LLCOrchard Grass Hills, KY | D 26How the Experts Score is calculatedEach factor is a percentile (0–100) against the other companies in this category, then weighted:Satisfaction 35%17+5.9Reliability 15%60+9Craft & service 20%12+2.4Value 10%3+0.3Momentum 8%9+0.7Track record 7%94+6.6Accountability 5%12+0.6Experts Score= 26Grade D: A = 80+, B = 60–79, C = 40–59, D = 20–39. Needs 10+ reviews. | FBFFFAF | 4.94 | — |
What jobs cost
What customers paid, from the price Google asks reviewers to report.
| Job | Low25th percentile: 1 in 4 customers paid less than this. | TypicalMedian of the bill customers reported in their Google review (Google asks reviewers for a price range; we use the middle of each range). | High75th percentile: 1 in 4 customers paid more than this. | FairOf customers who rated the price, the share who chose “Great price” or “Reasonable” rather than “Overpriced”. |
|---|
Was the price fair?
All price verdicts left with reviews.
Price verdicts by year
Share calling it great / reasonable / overpriced.
How we grade
Satisfaction (35%) — Recency-weighted star average (2-year half-life), shrunk toward the category mean by review volume.
Reliability (15%) — How rarely jobs go badly: share of 1–2★ reviews in the last 24 months (fewer = better).
Craft & service (20%) — Google review highlights: Quality, Professionalism, Responsiveness, Punctuality — net praise per review.
Value (10%) — Customers’ own price verdicts (Great / Reasonable vs Overpriced) and Value highlights.
Momentum (8%) — Last 12 months vs lifetime average — improving or slipping.
Track record (7%) — Review volume and years with reviews.
Accountability (5%) — Owner replies to 1–3★ reviews.
Choose a city to compare vetted tutors rated 4.5★+ on Google.