
The Best Video Production Companies in Las Vegas, NV
We graded 10 companies on seven things customers actually report: satisfaction, reliability, workmanship, value, momentum, track record and how owners handle complaints.
From 23,377 Google reviews of 277 top-rated video production companies nationwide; 10 of them in Las Vegas, NV. Updated November 10, 2026.
Find the right company for your job
Pick the job — we re-rank companies by how customers rated that exact job.
Best video production companies in Las Vegas for headshots and portraits
Clear ✕ Get Right MediaHow Job match is calculatedBuilt only from reviews Google tagged “Headshots and portraits”:Stars on this job 55%5.00★Number of such jobs 25%8Overall Experts Score 20%99Job match= 98Stars are pulled toward the category average (4.95★) when a company has few tagged jobs, so 3 perfect reviews don’t beat 80 great ones. 4.3★ scores 0, 5.0★ scores full. Volume is compared with the busiest company for this job.98
Job match = this company’s ★ on reviews Google tagged “Headshots and portraits” (shrunk toward the category average when there are few), how many such jobs it has done, and its overall Experts Score.
What customers said about headshots and portraits
Get Right MediaGet Right Media are very professional. Turn around is within a good timeframe. They really are with you through the journey to help grow your business! If something doesn’t work, they come with something else. They truly want to see your business thrive! Frequently checking in to see how they can help or where you see a need at.
Get Right MediaWe’ve been working with Brandon for over five years now, and he has consistently been one of our most reliable and talented creative partners. His work ethic is unmatched, and the quality of photos he delivers never fails to impress. No matter the timeline, whether we’re planning far in advance or need a…
Get Right MediaBrandon is a fantastic photographer, I highly recommend him for any photo/video projects you have. He takes the time to understand your business or project to ensure he can guide your decisions on location and the look and feel of your finished project. He's also really good at directing, as someone who hates…
Get Right MediaGreat experience with Brandon! Very professional, prompt, and knowledgeable. Highly recommended. Will definitely be back.
Get Right MediaI love using this studio! It’s a great space, and the owner is amazing to work with kind, helpful, and always makes the experience easy. Highly recommend!
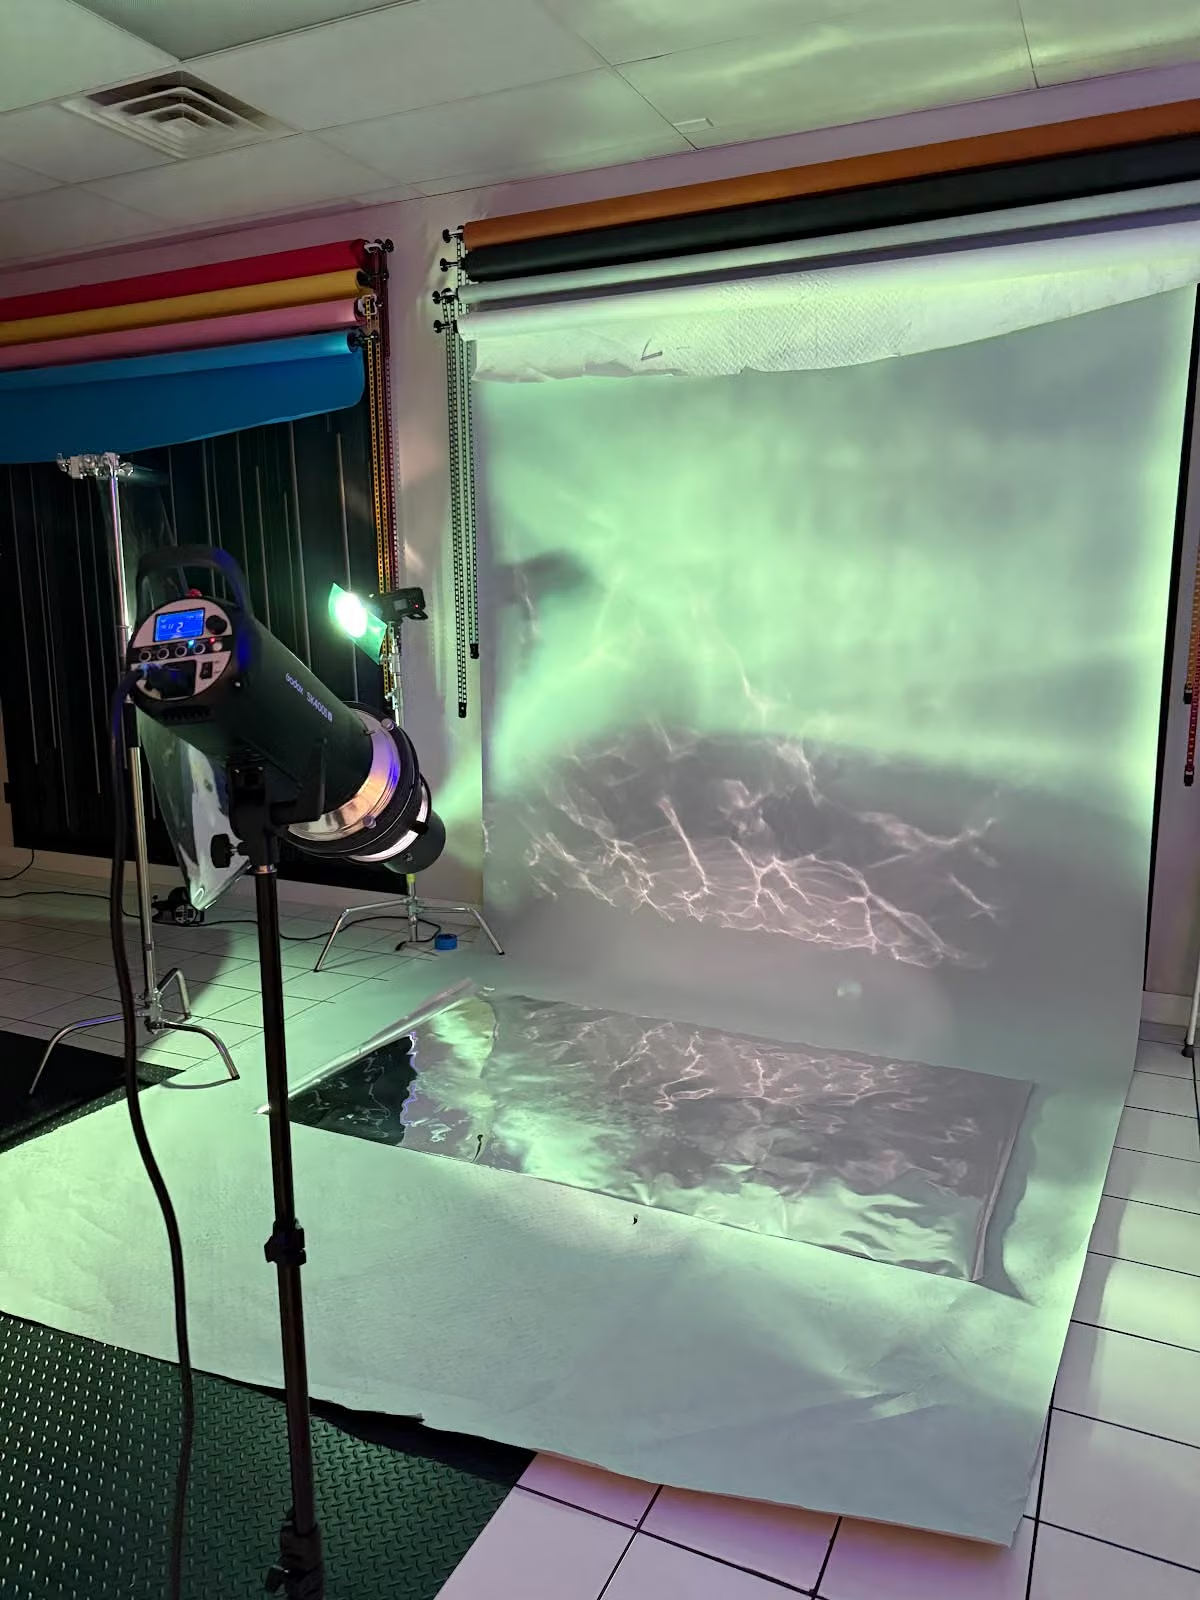
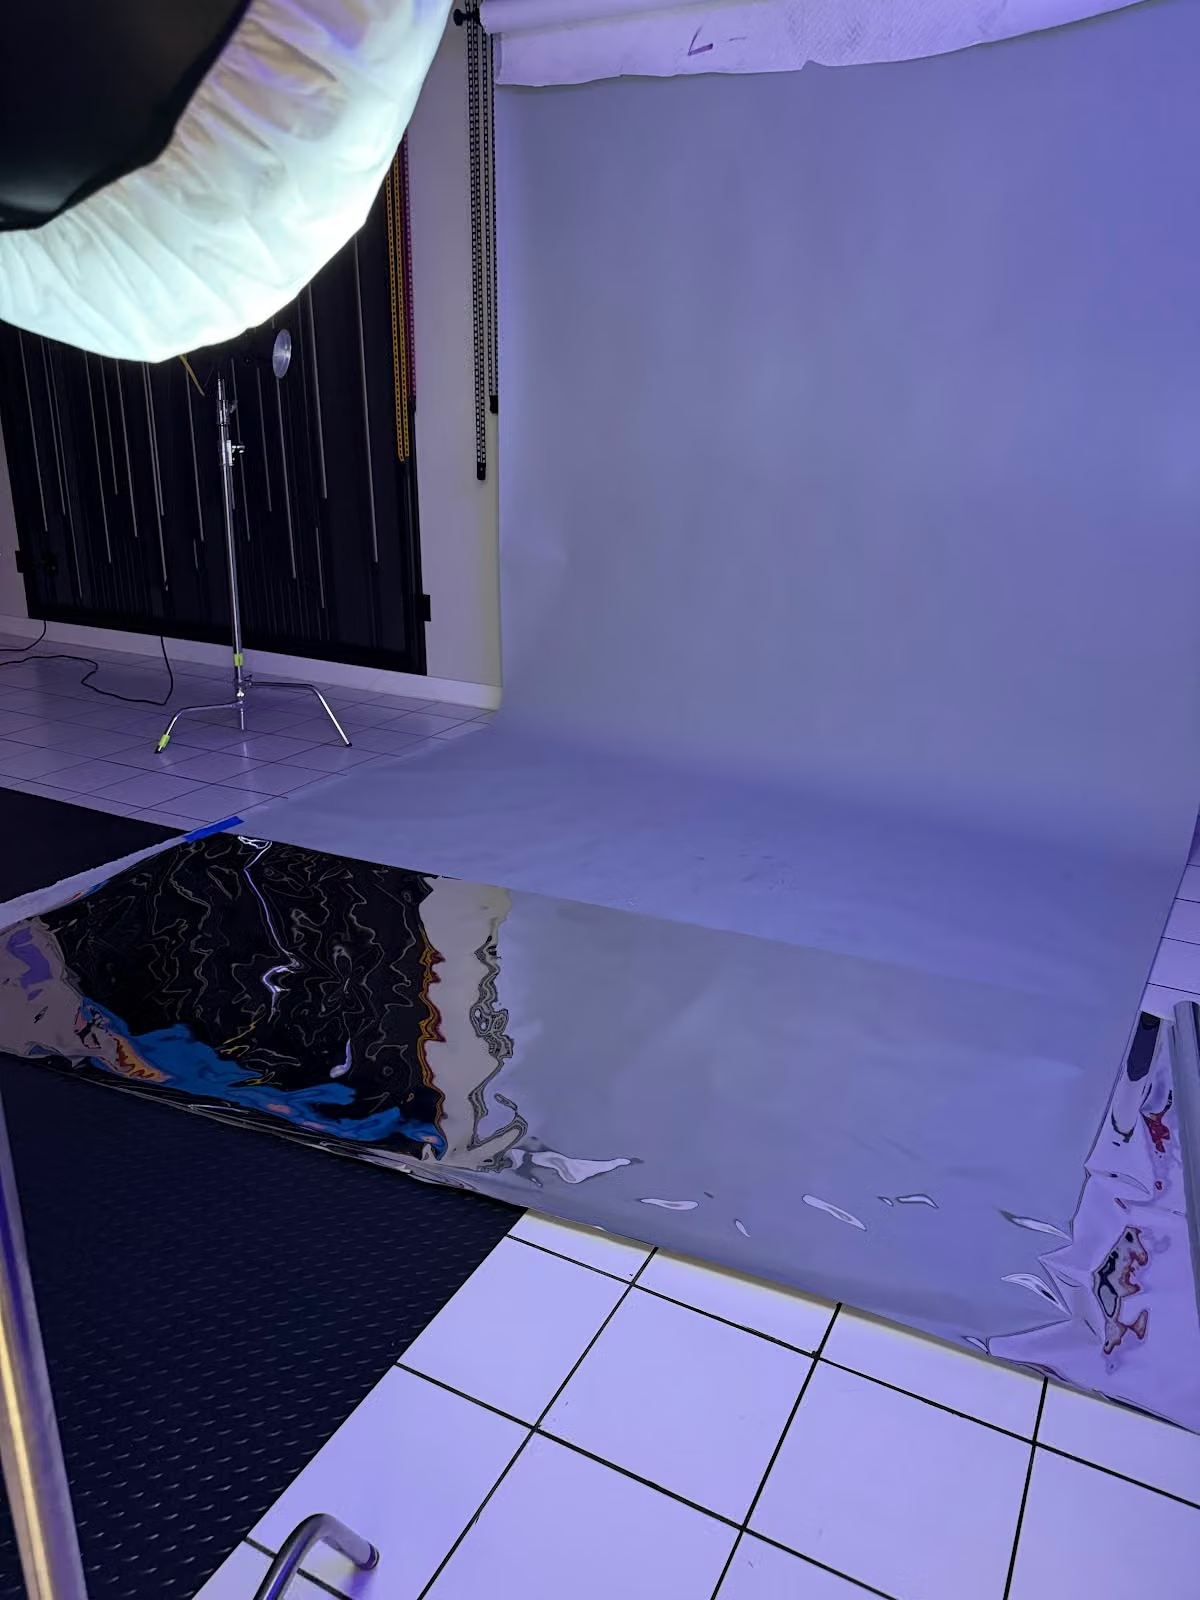
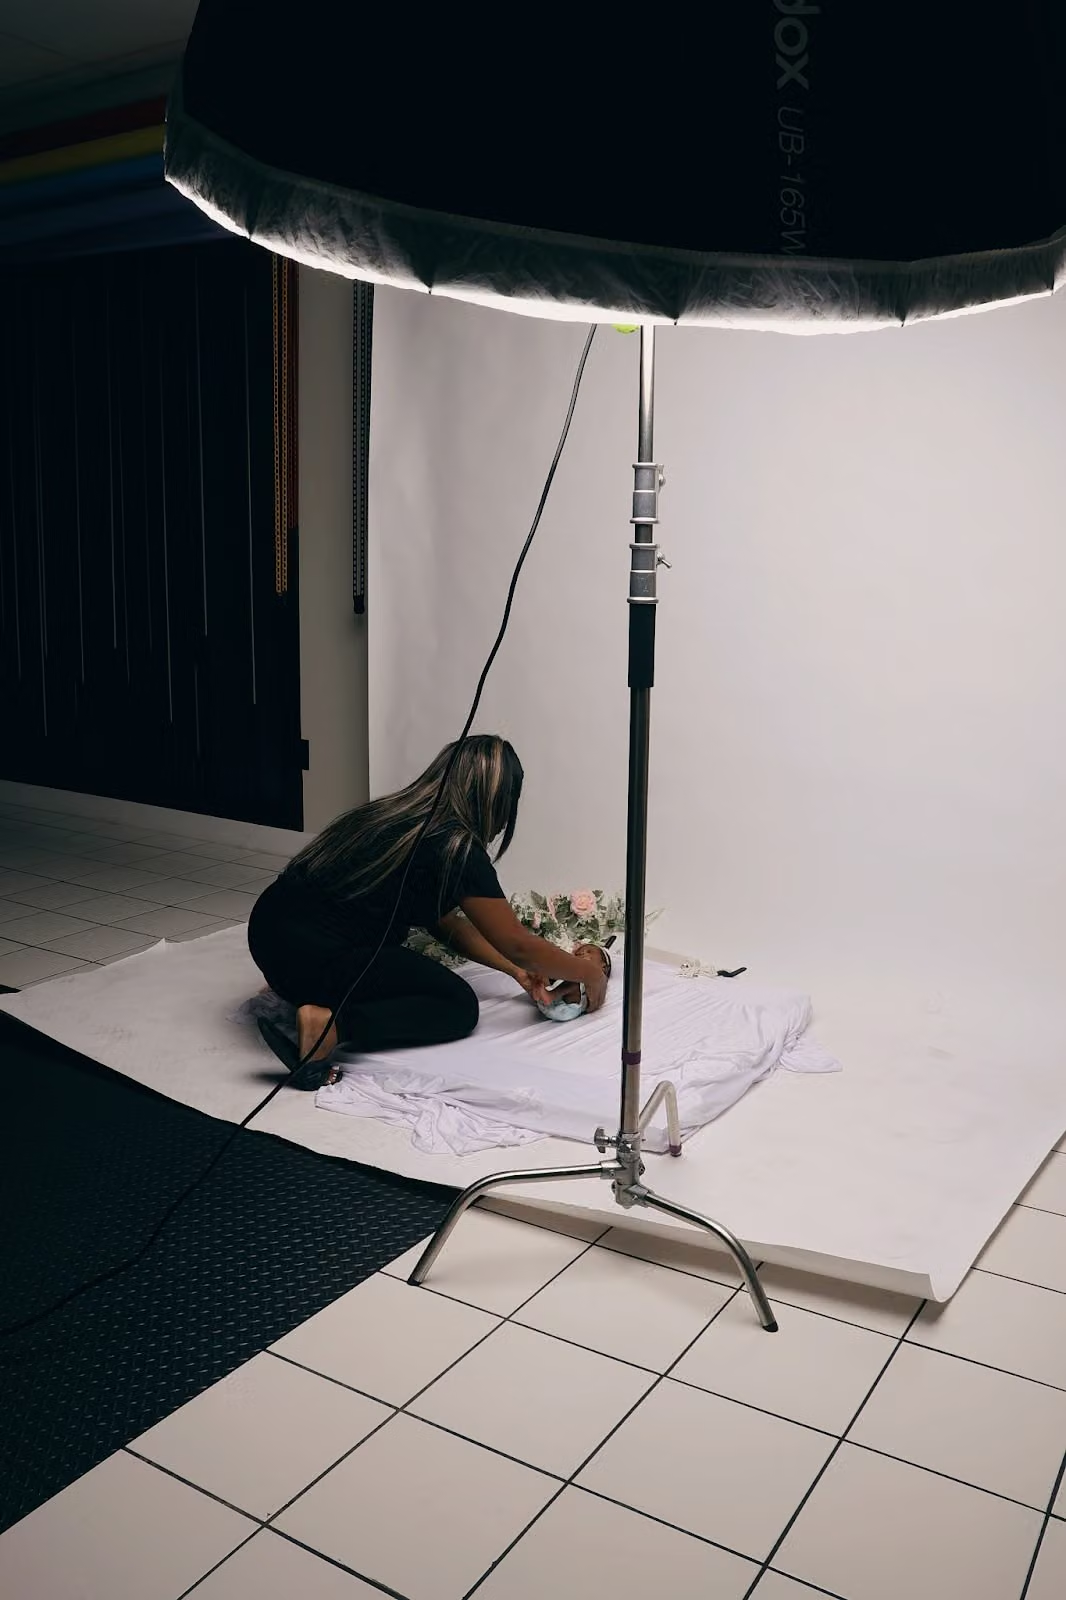 Get Right Media
Brandon is well experienced, professional, helped guide me to feel confident, and the cherry on top of it all; I had a very specific request and he was able to fulfill it day of with very little notice, overall worth the price and your time.
Overall ratings
Experts Score 0–100Experts Score (0–100)Absolute quality first: recency-weighted star average (≈54%), share of 1–2★ reviews (≈24%), customers’ price verdicts (≈14%), owner replies to critical reviews (≈7%); minus up to 10 points each for complaints flagged in Google review highlights and for a real slide in recent ratings. Hover a company’s score on its page for the full breakdown. and a letter grade per factor (A = top 20% of video production companies).
| # | Company | ScoreExperts Score (0–100)Absolute quality first: recency-weighted star average (≈54%), share of 1–2★ reviews (≈24%), customers’ price verdicts (≈14%), owner replies to critical reviews (≈7%); minus up to 10 points each for complaints flagged in Google review highlights and for a real slide in recent ratings. Hover a company’s score on its page for the full breakdown. | FactorsFactor grades, in orderSatisfaction (54%): Recency-weighted star average (2-year half-life), shrunk toward the category mean by review volume; the company’s own lifetime average as the prior; absolute: 4.0★ = 0, 5★ = 100.Reliability (24%): How rarely jobs go badly: share of 1–2★ reviews — 60% the last 24 months (or the 20 newest if fewer), 40% all-time; 0% = 100, 15%+ = 0; the category percentile can only raise it.Craft & service (0%): Google review highlights: Quality, Professionalism, Responsiveness, Punctuality — how rarely reviewers flag them as a negative, per review since highlights began; 0% = 100, 5%+ = 0. Subtracted from the score (up to −10), never averaged in — clean highlights are the norm, not a bonus.Value (14%): Customers’ own price verdicts (Great / Reasonable vs Overpriced) and Value highlights; 65% absolute (all “reasonable” ≈ 80, “great” = 100), the category percentile can only raise it.Momentum (0%): Penalises only a real slide: last-12-month average below lifetime (−0.5★ = 0). Still 4.8★+ over the last year, or steady/improving = 100. Subtracted from the score (up to −10), never averaged in.Replies to reviews (7%): How often the owner publicly replies to reviews under 5★ (1–4★). Needs 3+ such reviews, otherwise not counted; 65% absolute (80%+ replied = 100), the category percentile can only raise it.One letter per factor score: A = 80+, B = 60–79, C = 40–59, D = 20–39, F = below 20. | ★Google star rating as shown on Google Maps. | Typical billMedian bill customers of this company reported in their reviews (needs 3+ priced reviews). |
|---|---|---|---|---|---|
| 1 |  Cerious ProductionsLas Vegas, NV | A 100How the Experts Score is calculatedEach factor is scored 0–100 on absolute terms (standing in the category can only raise it), then weighted; problems flagged in review highlights or a recent slide in ratings are subtracted:Satisfaction 69%100+69.2Reliability 31%99+30.5Experts Score= 100Not enough data for value, replies to reviews; its weight is shared by the others.Grade A: A = 80+, B = 60–79, C = 40–59, D = 20–39. Needs 10+ reviews. | AA––A– | 5.00 | — |
| 2 |  Elite media productions llcLas Vegas, NV | A 100How the Experts Score is calculatedEach factor is scored 0–100 on absolute terms (standing in the category can only raise it), then weighted; problems flagged in review highlights or a recent slide in ratings are subtracted:Satisfaction 69%100+69.2Reliability 31%99+30.5Experts Score= 100Not enough data for value, replies to reviews; its weight is shared by the others.Grade A: A = 80+, B = 60–79, C = 40–59, D = 20–39. Needs 10+ reviews. | AA––A– | 5.00 | — |
| 3 | A 100How the Experts Score is calculatedEach factor is scored 0–100 on absolute terms (standing in the category can only raise it), then weighted; problems flagged in review highlights or a recent slide in ratings are subtracted:Satisfaction 69%100+69.2Reliability 31%99+30.5Experts Score= 100Not enough data for value, replies to reviews; its weight is shared by the others.Grade A: A = 80+, B = 60–79, C = 40–59, D = 20–39. Needs 10+ reviews. | AA––A– | 5.00 | — | |
| 4 |  Tailored MotionsLas Vegas, NV | A 100How the Experts Score is calculatedEach factor is scored 0–100 on absolute terms (standing in the category can only raise it), then weighted; problems flagged in review highlights or a recent slide in ratings are subtracted:Satisfaction 69%100+69.2Reliability 31%99+30.5Experts Score= 100Not enough data for value, replies to reviews; its weight is shared by the others.Grade A: A = 80+, B = 60–79, C = 40–59, D = 20–39. Needs 10+ reviews. | AA––A– | 5.00 | — |
| 5 | Get Right MediaLas Vegas, NV | A 99How the Experts Score is calculatedEach factor is scored 0–100 on absolute terms (standing in the category can only raise it), then weighted; problems flagged in review highlights or a recent slide in ratings are subtracted:Satisfaction 55%98+53.5Reliability 24%100+24.2Value 14%100+14.1Replies to reviews 7%95+6.7Experts Score= 99Grade A: A = 80+, B = 60–79, C = 40–59, D = 20–39. Needs 10+ reviews. | AA–AAA | 4.98 | — |
| 6 |  The Tone Factory Recording Studios - Las Vegas, NVLas Vegas, NV | A 99How the Experts Score is calculatedEach factor is scored 0–100 on absolute terms (standing in the category can only raise it), then weighted; problems flagged in review highlights or a recent slide in ratings are subtracted:Satisfaction 69%99+68.5Reliability 31%99+30.5Experts Score= 99Not enough data for value, replies to reviews; its weight is shared by the others.Grade A: A = 80+, B = 60–79, C = 40–59, D = 20–39. Needs 10+ reviews. | AA––A– | 4.99 | — |
| 7 |  Lomax StudiosLas Vegas, NV | A 99How the Experts Score is calculatedEach factor is scored 0–100 on absolute terms (standing in the category can only raise it), then weighted; problems flagged in review highlights or a recent slide in ratings are subtracted:Satisfaction 59%100+58.7Reliability 26%99+25.8Value 15%96+14.6Experts Score= 99Not enough data for replies to reviews; its weight is shared by the others.Grade A: A = 80+, B = 60–79, C = 40–59, D = 20–39. Needs 10+ reviews. | AAAAA– | 5.00 | — |
| 8 |  Izzo Pro Video & CinematographyLas Vegas, NV | A 98How the Experts Score is calculatedEach factor is scored 0–100 on absolute terms (standing in the category can only raise it), then weighted; problems flagged in review highlights or a recent slide in ratings are subtracted:Satisfaction 59%98+57.5Reliability 26%97+25.3Value 15%100+15.2Experts Score= 98Not enough data for replies to reviews; its weight is shared by the others.Grade A: A = 80+, B = 60–79, C = 40–59, D = 20–39. Needs 10+ reviews. | AAAAA– | 4.97 | — |
| 9 |  MGB Music - Recording StudioLas Vegas, NV | A 96How the Experts Score is calculatedEach factor is scored 0–100 on absolute terms (standing in the category can only raise it), then weighted; problems flagged in review highlights or a recent slide in ratings are subtracted:Satisfaction 69%95+65.8Reliability 31%98+30.2Experts Score= 96Not enough data for value, replies to reviews; its weight is shared by the others.Grade A: A = 80+, B = 60–79, C = 40–59, D = 20–39. Needs 10+ reviews. | AA–––– | 4.98 | — |
| 10 |  FiveSix ProductionsLas Vegas, NV | A 92How the Experts Score is calculatedEach factor is scored 0–100 on absolute terms (standing in the category can only raise it), then weighted; problems flagged in review highlights or a recent slide in ratings are subtracted:Satisfaction 55%96+52.4Reliability 24%98+23.8Value 14%87+12.3Replies to reviews 7%54+3.8Experts Score= 92Grade A: A = 80+, B = 60–79, C = 40–59, D = 20–39. Needs 10+ reviews. | AAAAAC | 4.96 | — |
What jobs cost
What customers paid, from the price Google asks reviewers to report.
| Job | Low25th percentile: 1 in 4 customers paid less than this. | TypicalMedian of the bill customers reported in their Google review (Google asks reviewers for a price range; we use the middle of each range). | High75th percentile: 1 in 4 customers paid more than this. | FairOf customers who rated the price, the share who chose “Great price” or “Reasonable” rather than “Overpriced”. |
|---|
Video Production Companies in Las Vegas, NV at a glance
How the 10 video production companies we rated in Las Vegas, NV compare, and what customers praise most.
Experts Score grades
A = score 80+, F = below 20.
- Grade A10100%
- Grade B00%
- Grade C00%
- Grade D00%
- Grade F00%
Google ratings
Average stars per company.
- 4.90★ and up10100%
- 4.80–4.89★00%
- 4.60–4.79★00%
- Below 4.60★00%
What customers praise
Share of Google review highlights.
- Quality1,58626%
- Professionalism1,75229%
- Responsiveness1,43924%
- Punctuality200%
- Value1,30421%
Was the price fair?
All price verdicts left with reviews.
- Great price17862%
- Reasonable9734%
- Overpriced52%
- Not sure62%
Price verdicts by year
Share calling it great / reasonable / overpriced.
How we grade
Satisfaction (54%) — Recency-weighted star average (2-year half-life), shrunk toward the category mean by review volume; the company’s own lifetime average as the prior; absolute: 4.0★ = 0, 5★ = 100.
Reliability (24%) — How rarely jobs go badly: share of 1–2★ reviews — 60% the last 24 months (or the 20 newest if fewer), 40% all-time; 0% = 100, 15%+ = 0; the category percentile can only raise it.
Craft & service (penalty, up to −10) — Google review highlights: Quality, Professionalism, Responsiveness, Punctuality — how rarely reviewers flag them as a negative, per review since highlights began; 0% = 100, 5%+ = 0. Subtracted from the score (up to −10), never averaged in — clean highlights are the norm, not a bonus.
Value (14%) — Customers’ own price verdicts (Great / Reasonable vs Overpriced) and Value highlights; 65% absolute (all “reasonable” ≈ 80, “great” = 100), the category percentile can only raise it.
Momentum (penalty, up to −10) — Penalises only a real slide: last-12-month average below lifetime (−0.5★ = 0). Still 4.8★+ over the last year, or steady/improving = 100. Subtracted from the score (up to −10), never averaged in.
Replies to reviews (7%) — How often the owner publicly replies to reviews under 5★ (1–4★). Needs 3+ such reviews, otherwise not counted; 65% absolute (80%+ replied = 100), the category percentile can only raise it.