
The Best Videographers in Lawrence, MA
We graded 9 companies on seven things customers actually report: satisfaction, reliability, workmanship, value, momentum, track record and how owners handle complaints.
From 20,196 Google reviews of 160 top-rated videographers nationwide; 9 of them in Lawrence, MA. Updated November 12, 2026.
Find the right company for your job
Pick the job — we re-rank companies by how customers rated that exact job.
Best videographers in Lawrence for family and group
Clear ✕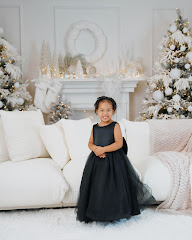 Waldy Photography StudioHow Job match is calculatedBuilt only from reviews Google tagged “Family and group”:Stars on this job 55%5.00★Number of such jobs 25%5Overall Experts Score 20%100Job match= 96Stars are pulled toward the category average (4.91★) when a company has few tagged jobs, so 3 perfect reviews don’t beat 80 great ones. 4.3★ scores 0, 5.0★ scores full. Volume is compared with the busiest company for this job.96
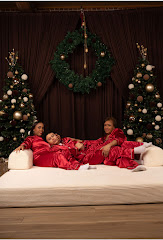 A.R PHOTOGRAPHYHow Job match is calculatedBuilt only from reviews Google tagged “Family and group”:Stars on this job 55%5.00★Number of such jobs 25%3Overall Experts Score 20%100Job match= 89Stars are pulled toward the category average (4.91★) when a company has few tagged jobs, so 3 perfect reviews don’t beat 80 great ones. 4.3★ scores 0, 5.0★ scores full. Volume is compared with the busiest company for this job.89
Job match = this company’s ★ on reviews Google tagged “Family and group” (shrunk toward the category average when there are few), how many such jobs it has done, and its overall Experts Score.
What customers said about family and group
Waldy Photography StudioI am so happy with the outcomes of the photos of my little family and I. He made the photoshoot stress free!
A.R PHOTOGRAPHYI highly recommend AR Photographer to anyone looking for reliable, talented, and friendly photography services. I’ll definitely be booking with them again!
Waldy Photography StudioGreat guy! Good customer service. He’s so fun to work with! Our pictures came out so good!!!
Waldy Photography StudioWe had an amazing experience with our maternity photoshoot! The pictures turned out absolutely beautiful, and the photographer was so warm, welcoming, and professional. My family and I felt comfortable from the moment we arrived, which made the entire session relaxed and enjoyable. We couldn't be happier with the…
Waldy Photography Studiowaldy and his team were amazing to us. We were able to changed our cloths in the studio and we were available to come in 30 min earlier to get dressed. We loved how our pictures came out.
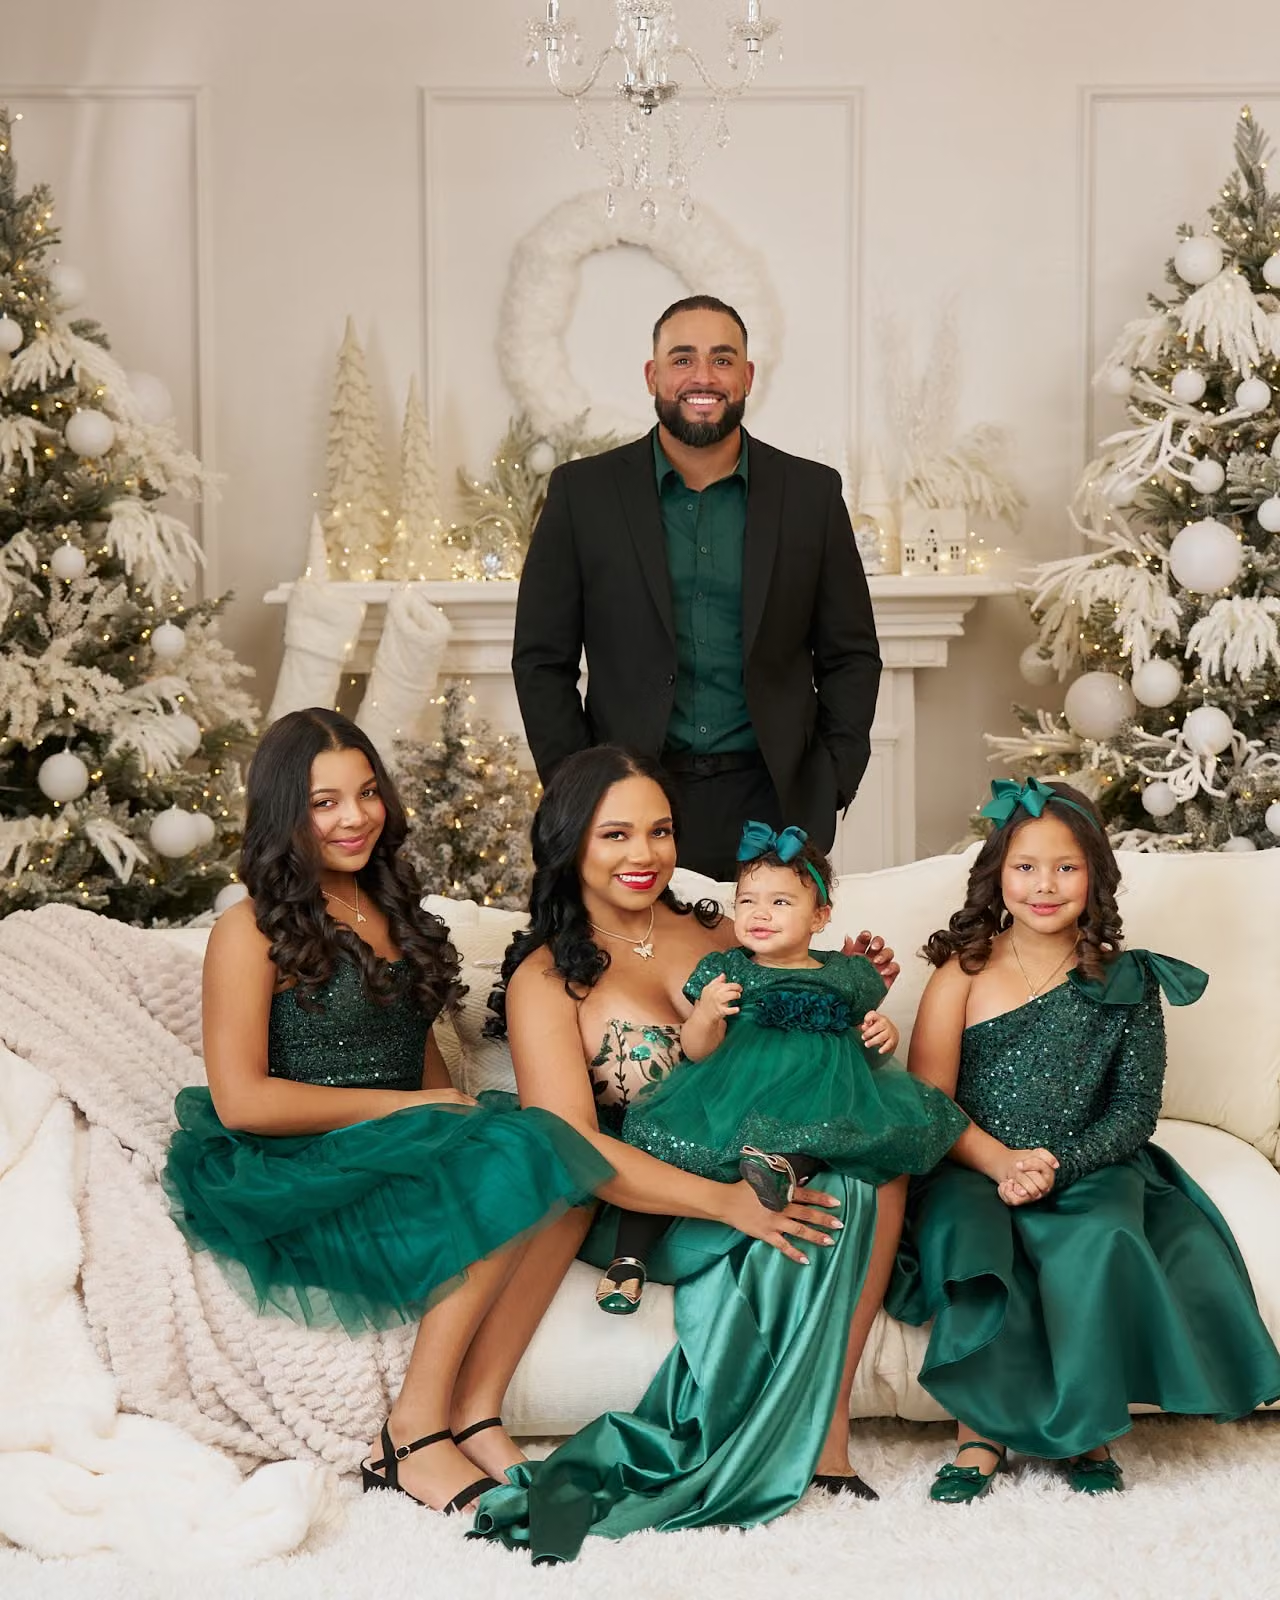 A.R PHOTOGRAPHY
I had an amazing experience with AR Photography! They made me feel so comfortable throughout the entire session and captured such beautiful, natural shots. The photos turned out even better than I imagined. I’m so grateful for their talent and professionalism. Highly recommend AR Photography to anyone looking for stunning photos!
Overall ratings
Experts Score 0–100Experts Score (0–100)Absolute quality first: recency-weighted star average (≈54%), share of 1–2★ reviews (≈24%), customers’ price verdicts (≈14%), owner replies to critical reviews (≈7%); minus up to 10 points each for complaints flagged in Google review highlights and for a real slide in recent ratings. Hover a company’s score on its page for the full breakdown. and a letter grade per factor (A = top 20% of videographers).
| # | Company | ScoreExperts Score (0–100)Absolute quality first: recency-weighted star average (≈54%), share of 1–2★ reviews (≈24%), customers’ price verdicts (≈14%), owner replies to critical reviews (≈7%); minus up to 10 points each for complaints flagged in Google review highlights and for a real slide in recent ratings. Hover a company’s score on its page for the full breakdown. | FactorsFactor grades, in orderSatisfaction (54%): Recency-weighted star average (2-year half-life), shrunk toward the category mean by review volume; the company’s own lifetime average as the prior; absolute: 4.0★ = 0, 5★ = 100.Reliability (24%): How rarely jobs go badly: share of 1–2★ reviews — 60% the last 24 months (or the 20 newest if fewer), 40% all-time; 0% = 100, 15%+ = 0; the category percentile can only raise it.Craft & service (0%): Google review highlights: Quality, Professionalism, Responsiveness, Punctuality — how rarely reviewers flag them as a negative, per review since highlights began; 0% = 100, 5%+ = 0. Subtracted from the score (up to −10), never averaged in — clean highlights are the norm, not a bonus.Value (14%): Customers’ own price verdicts (Great / Reasonable vs Overpriced) and Value highlights; 65% absolute (all “reasonable” ≈ 80, “great” = 100), the category percentile can only raise it.Momentum (0%): Penalises only a real slide: last-12-month average below lifetime (−0.5★ = 0). Still 4.8★+ over the last year, or steady/improving = 100. Subtracted from the score (up to −10), never averaged in.Replies to reviews (7%): How often the owner publicly replies to reviews under 5★ (1–4★). Needs 3+ such reviews, otherwise not counted; 65% absolute (80%+ replied = 100), the category percentile can only raise it.One letter per factor score: A = 80+, B = 60–79, C = 40–59, D = 20–39, F = below 20. | ★Google star rating as shown on Google Maps. | Typical billMedian bill customers of this company reported in their reviews (needs 3+ priced reviews). |
|---|---|---|---|---|---|
| 1 | A.R PHOTOGRAPHYLawrence, MA | A 100How the Experts Score is calculatedEach factor is scored 0–100 on absolute terms (standing in the category can only raise it), then weighted; problems flagged in review highlights or a recent slide in ratings are subtracted:Satisfaction 59%100+58.7Reliability 26%99+25.8Value 15%100+15.2Experts Score= 100Not enough data for replies to reviews; its weight is shared by the others.Grade A: A = 80+, B = 60–79, C = 40–59, D = 20–39. Needs 10+ reviews. | AAAAA– | 5.00 | — |
| 2 | Waldy Photography StudioLawrence, MA | A 100How the Experts Score is calculatedEach factor is scored 0–100 on absolute terms (standing in the category can only raise it), then weighted; problems flagged in review highlights or a recent slide in ratings are subtracted:Satisfaction 59%100+58.7Reliability 26%99+25.8Value 15%100+15.2Experts Score= 100Not enough data for replies to reviews; its weight is shared by the others.Grade A: A = 80+, B = 60–79, C = 40–59, D = 20–39. Needs 10+ reviews. | AA–AA– | 5.00 | — |
| 3 |  Metzger StudiosLawrence, MA | A 99How the Experts Score is calculatedEach factor is scored 0–100 on absolute terms (standing in the category can only raise it), then weighted; problems flagged in review highlights or a recent slide in ratings are subtracted:Satisfaction 59%100+58.7Reliability 26%98+25.6Value 15%99+15.1Experts Score= 99Not enough data for replies to reviews; its weight is shared by the others.Grade A: A = 80+, B = 60–79, C = 40–59, D = 20–39. Needs 10+ reviews. | AAAAA– | 5.00 | — |
| 4 |  Cordele Photography (inside Boston)Lawrence, MA | A 99How the Experts Score is calculatedEach factor is scored 0–100 on absolute terms (standing in the category can only raise it), then weighted; problems flagged in review highlights or a recent slide in ratings are subtracted:Satisfaction 59%100+58.7Reliability 26%98+25.6Value 15%100+15.2Experts Score= 99Not enough data for replies to reviews; its weight is shared by the others.Grade A: A = 80+, B = 60–79, C = 40–59, D = 20–39. Needs 10+ reviews. | AAAAA– | 5.00 | — |
| 5 |  Without A HitchLawrence, MA | A 98How the Experts Score is calculatedEach factor is scored 0–100 on absolute terms (standing in the category can only raise it), then weighted; problems flagged in review highlights or a recent slide in ratings are subtracted:Satisfaction 59%100+58.7Reliability 26%98+25.6Value 15%93+14.2Experts Score= 98Not enough data for replies to reviews; its weight is shared by the others.Grade A: A = 80+, B = 60–79, C = 40–59, D = 20–39. Needs 10+ reviews. | AAAAA– | 5.00 | — |
| 6 |  Alexproductions Photographer & VideographerLawrence, MA | A 98How the Experts Score is calculatedEach factor is scored 0–100 on absolute terms (standing in the category can only raise it), then weighted; problems flagged in review highlights or a recent slide in ratings are subtracted:Satisfaction 55%99+54Reliability 24%98+23.8Value 14%100+14.1Replies to reviews 7%88+6.2Experts Score= 98Grade A: A = 80+, B = 60–79, C = 40–59, D = 20–39. Needs 10+ reviews. | AA–AAA | 4.98 | — |
| 7 |  Cassandra Lauren PhotographyLawrence, MA | A 98How the Experts Score is calculatedEach factor is scored 0–100 on absolute terms (standing in the category can only raise it), then weighted; problems flagged in review highlights or a recent slide in ratings are subtracted:Satisfaction 59%99+58.1Reliability 26%98+25.6Value 15%96+14.6Experts Score= 98Not enough data for replies to reviews; its weight is shared by the others.Grade A: A = 80+, B = 60–79, C = 40–59, D = 20–39. Needs 10+ reviews. | AA–AA– | 5.00 | — |
| 8 |  Louise Michaud PhotographerLawrence, MA | A 93How the Experts Score is calculatedEach factor is scored 0–100 on absolute terms (standing in the category can only raise it), then weighted; problems flagged in review highlights or a recent slide in ratings are subtracted:Satisfaction 55%95+51.8Reliability 24%91+22.1Value 14%100+14.1Replies to reviews 7%67+4.7Experts Score= 93Grade A: A = 80+, B = 60–79, C = 40–59, D = 20–39. Needs 10+ reviews. | AAAAAB | 4.96 | — |
| 9 |  PTaufiq PhotographyLawrence, MA | B 76How the Experts Score is calculatedEach factor is scored 0–100 on absolute terms (standing in the category can only raise it), then weighted; problems flagged in review highlights or a recent slide in ratings are subtracted:Satisfaction 55%82+44.7Reliability 24%67+16.2Value 14%100+14.1Replies to reviews 7%46+3.3Momentum penalty75−2.5Experts Score= 76Grade B: A = 80+, B = 60–79, C = 40–59, D = 20–39. Needs 10+ reviews. | ABAABC | 4.88 | — |
What jobs cost
What customers paid, from the price Google asks reviewers to report.
| Job | Low25th percentile: 1 in 4 customers paid less than this. | TypicalMedian of the bill customers reported in their Google review (Google asks reviewers for a price range; we use the middle of each range). | High75th percentile: 1 in 4 customers paid more than this. | FairOf customers who rated the price, the share who chose “Great price” or “Reasonable” rather than “Overpriced”. |
|---|
Videographers in Lawrence, MA at a glance
How the 9 videographers we rated in Lawrence, MA compare, and what customers praise most.
Experts Score grades
A = score 80+, F = below 20.
- Grade A889%
- Grade B111%
- Grade C00%
- Grade D00%
- Grade F00%
Google ratings
Average stars per company.
- 4.90★ and up889%
- 4.80–4.89★111%
- 4.60–4.79★00%
- Below 4.60★00%
What customers praise
Share of Google review highlights.
- Quality1,52926%
- Professionalism1,61628%
- Responsiveness1,35623%
- Punctuality461%
- Value1,32223%
Was the price fair?
All price verdicts left with reviews.
- Great price66666%
- Reasonable32832%
- Overpriced40%
- Not sure141%
Price verdicts by year
Share calling it great / reasonable / overpriced.
How we grade
Satisfaction (54%) — Recency-weighted star average (2-year half-life), shrunk toward the category mean by review volume; the company’s own lifetime average as the prior; absolute: 4.0★ = 0, 5★ = 100.
Reliability (24%) — How rarely jobs go badly: share of 1–2★ reviews — 60% the last 24 months (or the 20 newest if fewer), 40% all-time; 0% = 100, 15%+ = 0; the category percentile can only raise it.
Craft & service (penalty, up to −10) — Google review highlights: Quality, Professionalism, Responsiveness, Punctuality — how rarely reviewers flag them as a negative, per review since highlights began; 0% = 100, 5%+ = 0. Subtracted from the score (up to −10), never averaged in — clean highlights are the norm, not a bonus.
Value (14%) — Customers’ own price verdicts (Great / Reasonable vs Overpriced) and Value highlights; 65% absolute (all “reasonable” ≈ 80, “great” = 100), the category percentile can only raise it.
Momentum (penalty, up to −10) — Penalises only a real slide: last-12-month average below lifetime (−0.5★ = 0). Still 4.8★+ over the last year, or steady/improving = 100. Subtracted from the score (up to −10), never averaged in.
Replies to reviews (7%) — How often the owner publicly replies to reviews under 5★ (1–4★). Needs 3+ such reviews, otherwise not counted; 65% absolute (80%+ replied = 100), the category percentile can only raise it.