
The Best Flea Exterminators
We graded 40 companies on seven things customers actually report: satisfaction, reliability, workmanship, value, momentum, track record and how owners handle complaints.
From 25,578 Google reviews of 40 top-rated flea exterminators nationwide. Updated October 25, 2026.
Find the right company for your job
Pick the job — we re-rank companies by how customers rated that exact job.
Best flea exterminators for nuisance animals
Clear ✕ Amco Ranger Termite & Pest SolutionsHow Job match is calculatedBuilt only from reviews Google tagged “Nuisance animals”:Stars on this job 55%5.00★Number of such jobs 25%3Overall Experts Score 20%71Job match= 74Stars are pulled toward the category average (4.91★) when a company has few tagged jobs, so 3 perfect reviews don’t beat 80 great ones. 4.3★ scores 0, 5.0★ scores full. Volume is compared with the busiest company for this job.74
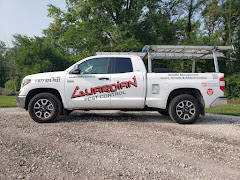 Guardian Pest ControlHow Job match is calculatedBuilt only from reviews Google tagged “Nuisance animals”:Stars on this job 55%5.00★Number of such jobs 25%3Overall Experts Score 20%42Job match= 68Stars are pulled toward the category average (4.91★) when a company has few tagged jobs, so 3 perfect reviews don’t beat 80 great ones. 4.3★ scores 0, 5.0★ scores full. Volume is compared with the busiest company for this job.68
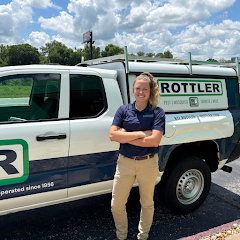 Rottler Pest SolutionsHow Job match is calculatedBuilt only from reviews Google tagged “Nuisance animals”:Stars on this job 55%4.66★Number of such jobs 25%32Overall Experts Score 20%57Job match= 68Stars are pulled toward the category average (4.91★) when a company has few tagged jobs, so 3 perfect reviews don’t beat 80 great ones. 4.3★ scores 0, 5.0★ scores full. Volume is compared with the busiest company for this job.68
Job match = this company’s ★ on reviews Google tagged “Nuisance animals” (shrunk toward the category average when there are few), how many such jobs it has done, and its overall Experts Score.
What customers said about nuisance animals
Rottler Pest SolutionsTrey is great. He communicates everything and always goes above and beyond. Need more like him :)
Amco Ranger Termite & Pes…Brian is fantastic! Very thorough and helpful! Knowledgeable with the variety of spiders and bugs. Does great work and friendly!
Rottler Pest SolutionsGreat service. Very responsive. Helped immensely with our critter problem impacting our new sod
Rottler Pest SolutionsBlake and Jimmy did great work. Job was in a difficult part of the roof. They worked safely and efficiently to remove squirrel nesting materials and to prevent further issues. Much appreciated.
Rottler Pest SolutionsHe got a racoon that was causing destruction and making alot of noise. Blake was on time and dI'd everything he said he would do and was very polite.
Rottler Pest SolutionsHad squirrels chew through my roof and I called rottler one evening and Blake was here the next morning coming up with a plan of attack. He communicated well through the entire service and was very thorough. Thank you so much Blake!!
Overall ratings
Experts Score 0–100Experts Score (0–100)Weighted average of 7 percentiles vs other companies in the category: satisfaction 35%, workmanship 20%, reliability 15%, value 10%, momentum 8%, track record 7%, owner replies 5%. Hover a company’s score on its page for the full breakdown. and a letter grade per factor (A = top 20% of flea exterminators).
| # | Company | ScoreExperts Score (0–100)Weighted average of 7 percentiles vs other companies in the category: satisfaction 35%, workmanship 20%, reliability 15%, value 10%, momentum 8%, track record 7%, owner replies 5%. Hover a company’s score on its page for the full breakdown. | FactorsFactor grades, in orderSatisfaction (35%): Recency-weighted star average (2-year half-life), shrunk toward the category mean by review volume.Reliability (15%): How rarely jobs go badly: share of 1–2★ reviews in the last 24 months (fewer = better).Craft & service (20%): Google review highlights: Quality, Professionalism, Responsiveness, Punctuality — net praise per review.Value (10%): Customers’ own price verdicts (Great / Reasonable vs Overpriced) and Value highlights.Momentum (8%): Last 12 months vs lifetime average — improving or slipping.Track record (7%): Review volume and years with reviews.Accountability (5%): Owner replies to 1–3★ reviews.One letter per factor, by percentile among peers: A = top 20%, B = next 20%, and so on. | ★Google star rating as shown on Google Maps. | Typical billMedian bill customers of this company reported in their reviews (needs 3+ priced reviews). |
|---|---|---|---|---|---|
| 1 |  Keller's Pest ControlLongboat Key, FL | B 78How the Experts Score is calculatedEach factor is a percentile (0–100) against the other companies in this category, then weighted:Satisfaction 35%81+28.4Reliability 15%71+10.7Craft & service 20%66+13.2Value 10%91+9.1Momentum 8%78+6.2Track record 7%91+6.4Accountability 5%84+4.2Experts Score= 78Grade B: A = 80+, B = 60–79, C = 40–59, D = 20–39. Needs 10+ reviews. | ABBABAA | 4.95 | $86 |
| 2 |  Midwest Pest Solutions, LLCOak Lawn, IL | B 76How the Experts Score is calculatedEach factor is a percentile (0–100) against the other companies in this category, then weighted:Satisfaction 35%74+25.9Reliability 15%96+14.4Craft & service 20%78+15.6Value 10%85+8.5Momentum 8%83+6.6Track record 7%26+1.8Accountability 5%60+3Experts Score= 76Grade B: A = 80+, B = 60–79, C = 40–59, D = 20–39. Needs 10+ reviews. | BABAADB | 4.96 | $186 |
| 3 |  Pure Pest + LawnFlorissant, MO | B 75How the Experts Score is calculatedEach factor is a percentile (0–100) against the other companies in this category, then weighted:Satisfaction 35%76+26.6Reliability 15%76+11.4Craft & service 20%99+19.8Value 10%66+6.6Momentum 8%24+1.9Track record 7%89+6.2Accountability 5%56+2.8Experts Score= 75Grade B: A = 80+, B = 60–79, C = 40–59, D = 20–39. Needs 10+ reviews. | BBABDAC | 4.97 | $121 |
| 4 |  Bigfoot Pest ControlOak Lawn, IL | B 73How the Experts Score is calculatedEach factor is a percentile (0–100) against the other companies in this category, then weighted:Satisfaction 35%59+20.7Reliability 15%89+13.4Craft & service 20%87+17.4Value 10%82+8.2Momentum 8%71+5.7Track record 7%54+3.8Accountability 5%74+3.7Experts Score= 73Grade B: A = 80+, B = 60–79, C = 40–59, D = 20–39. Needs 10+ reviews. | CAAABCB | 4.96 | $347 |
| 5 |  Blitz Exterminators, LLCMacon-Bibb County, GA | B 73How the Experts Score is calculatedEach factor is a percentile (0–100) against the other companies in this category, then weighted:Satisfaction 35%84+29.4Reliability 15%69+10.4Craft & service 20%60+12Value 10%88+8.8Momentum 8%53+4.2Track record 7%49+3.4Accountability 5%86+4.3Experts Score= 73Grade B: A = 80+, B = 60–79, C = 40–59, D = 20–39. Needs 10+ reviews. | ABBACCA | 4.97 | $103 |
| 6 |  Frontline Pest ControlOak Lawn, IL | B 71How the Experts Score is calculatedEach factor is a percentile (0–100) against the other companies in this category, then weighted:Satisfaction 35%91+31.9Reliability 15%81+12.2Craft & service 20%54+10.8Value 10%69+6.9Momentum 8%55+4.4Track record 7%34+2.4Accountability 5%46+2.3Experts Score= 71Grade B: A = 80+, B = 60–79, C = 40–59, D = 20–39. Needs 10+ reviews. | AACBCDC | 4.99 | — |
| 7 | Amco Ranger Termite & Pest SolutionsFlorissant, MO | B 71How the Experts Score is calculatedEach factor is a percentile (0–100) against the other companies in this category, then weighted:Satisfaction 35%66+23.1Reliability 15%49+7.4Craft & service 20%84+16.8Value 10%61+6.1Momentum 8%76+6.1Track record 7%99+6.9Accountability 5%94+4.7Experts Score= 71Grade B: A = 80+, B = 60–79, C = 40–59, D = 20–39. Needs 10+ reviews. | BCABBAA | 4.94 | $71 |
| 8 |  Landmark Pest ManagementOak Lawn, IL | B 70How the Experts Score is calculatedEach factor is a percentile (0–100) against the other companies in this category, then weighted:Satisfaction 35%99+34.7Reliability 15%99+14.9Craft & service 20%40+8Value 10%20+2Momentum 8%58+4.6Track record 7%61+4.3Accountability 5%26+1.3Experts Score= 70Grade B: A = 80+, B = 60–79, C = 40–59, D = 20–39. Needs 10+ reviews. | AACDCBD | 4.99 | $73 |
| 9 |  Mosquito & Pest Authority of MaconMacon-Bibb County, GA | B 70How the Experts Score is calculatedEach factor is a percentile (0–100) against the other companies in this category, then weighted:Satisfaction 50%86+43Reliability 21%86+18.4Momentum 11%42+4.8Track record 10%4+0.4Accountability 7%46+3.3Experts Score= 70Not enough data for craft & service, value; its weight is shared by the others.Grade B: A = 80+, B = 60–79, C = 40–59, D = 20–39. Needs 10+ reviews. | AA––CFC | 5.00 | — |
| 10 |  Eco Tech Pest ControlOak Lawn, IL | B 68How the Experts Score is calculatedEach factor is a percentile (0–100) against the other companies in this category, then weighted:Satisfaction 35%69+24.2Reliability 15%56+8.4Craft & service 20%81+16.2Value 10%50+5Momentum 8%50+4Track record 7%94+6.6Accountability 5%76+3.8Experts Score= 68Grade B: A = 80+, B = 60–79, C = 40–59, D = 20–39. Needs 10+ reviews. | BCACCAB | 4.95 | $246 |
| 11 |  Pest Magic, LLC.Macon-Bibb County, GA | B 67How the Experts Score is calculatedEach factor is a percentile (0–100) against the other companies in this category, then weighted:Satisfaction 35%96+33.6Reliability 15%94+14.1Craft & service 20%16+3.2Value 10%99+9.9Momentum 8%42+3.4Track record 7%6+0.4Accountability 5%46+2.3Experts Score= 67Grade B: A = 80+, B = 60–79, C = 40–59, D = 20–39. Needs 10+ reviews. | AAFACFC | 5.00 | $60 |
| 12 |  Chem-Wise Pest ManagementOak Lawn, IL | B 66How the Experts Score is calculatedEach factor is a percentile (0–100) against the other companies in this category, then weighted:Satisfaction 35%64+22.4Reliability 15%44+6.6Craft & service 20%90+18Value 10%77+7.7Momentum 8%35+2.8Track record 7%69+4.8Accountability 5%81+4.1Experts Score= 66Grade B: A = 80+, B = 60–79, C = 40–59, D = 20–39. Needs 10+ reviews. | BCABDBA | 4.95 | $126 |
What jobs cost
What customers paid, from the price Google asks reviewers to report.
| Job | Low25th percentile: 1 in 4 customers paid less than this. | TypicalMedian of the bill customers reported in their Google review (Google asks reviewers for a price range; we use the middle of each range). | High75th percentile: 1 in 4 customers paid more than this. | FairOf customers who rated the price, the share who chose “Great price” or “Reasonable” rather than “Overpriced”. |
|---|---|---|---|---|
| General pest inspection | $68 | $106 | $141 | 99% |
| Bug & insect extermination | $71 | $99 | $131 | 98% |
| Rodent extermination | $71 | $108 | $246 | 97% |
| Ant extermination | $80 | $140 | $222 | 98% |
| Spider extermination | $91 | $133 | $184 | 98% |
| Home inspection | $93 | $126 | $181 | 96% |
| Cockroach extermination | $68 | $103 | $246 | 98% |
| Hornet & wasp extermination | $96 | $192 | $323 | 99% |
| Termite inspection | $79 | $99 | $184 | 97% |
| Mosquito extermination | $81 | $93 | $109 | 100% |
| Termite extermination | $91 | $214 | $371 | 98% |
| Flea & mite extermination | $90 | $246 | $371 | 99% |
Was the price fair?
All price verdicts left with reviews.
Price verdicts by year
Share calling it great / reasonable / overpriced.
How we grade
Satisfaction (35%) — Recency-weighted star average (2-year half-life), shrunk toward the category mean by review volume.
Reliability (15%) — How rarely jobs go badly: share of 1–2★ reviews in the last 24 months (fewer = better).
Craft & service (20%) — Google review highlights: Quality, Professionalism, Responsiveness, Punctuality — net praise per review.
Value (10%) — Customers’ own price verdicts (Great / Reasonable vs Overpriced) and Value highlights.
Momentum (8%) — Last 12 months vs lifetime average — improving or slipping.
Track record (7%) — Review volume and years with reviews.
Accountability (5%) — Owner replies to 1–3★ reviews.